Sunset, Vancouver, Canada (CA-Sunset)
Jump to section:
- Site forcing metadata
- Site images
- Site characteristics
- Site forcing
- Quality control and gap filling procedure
- Bias correction diurnal comparison
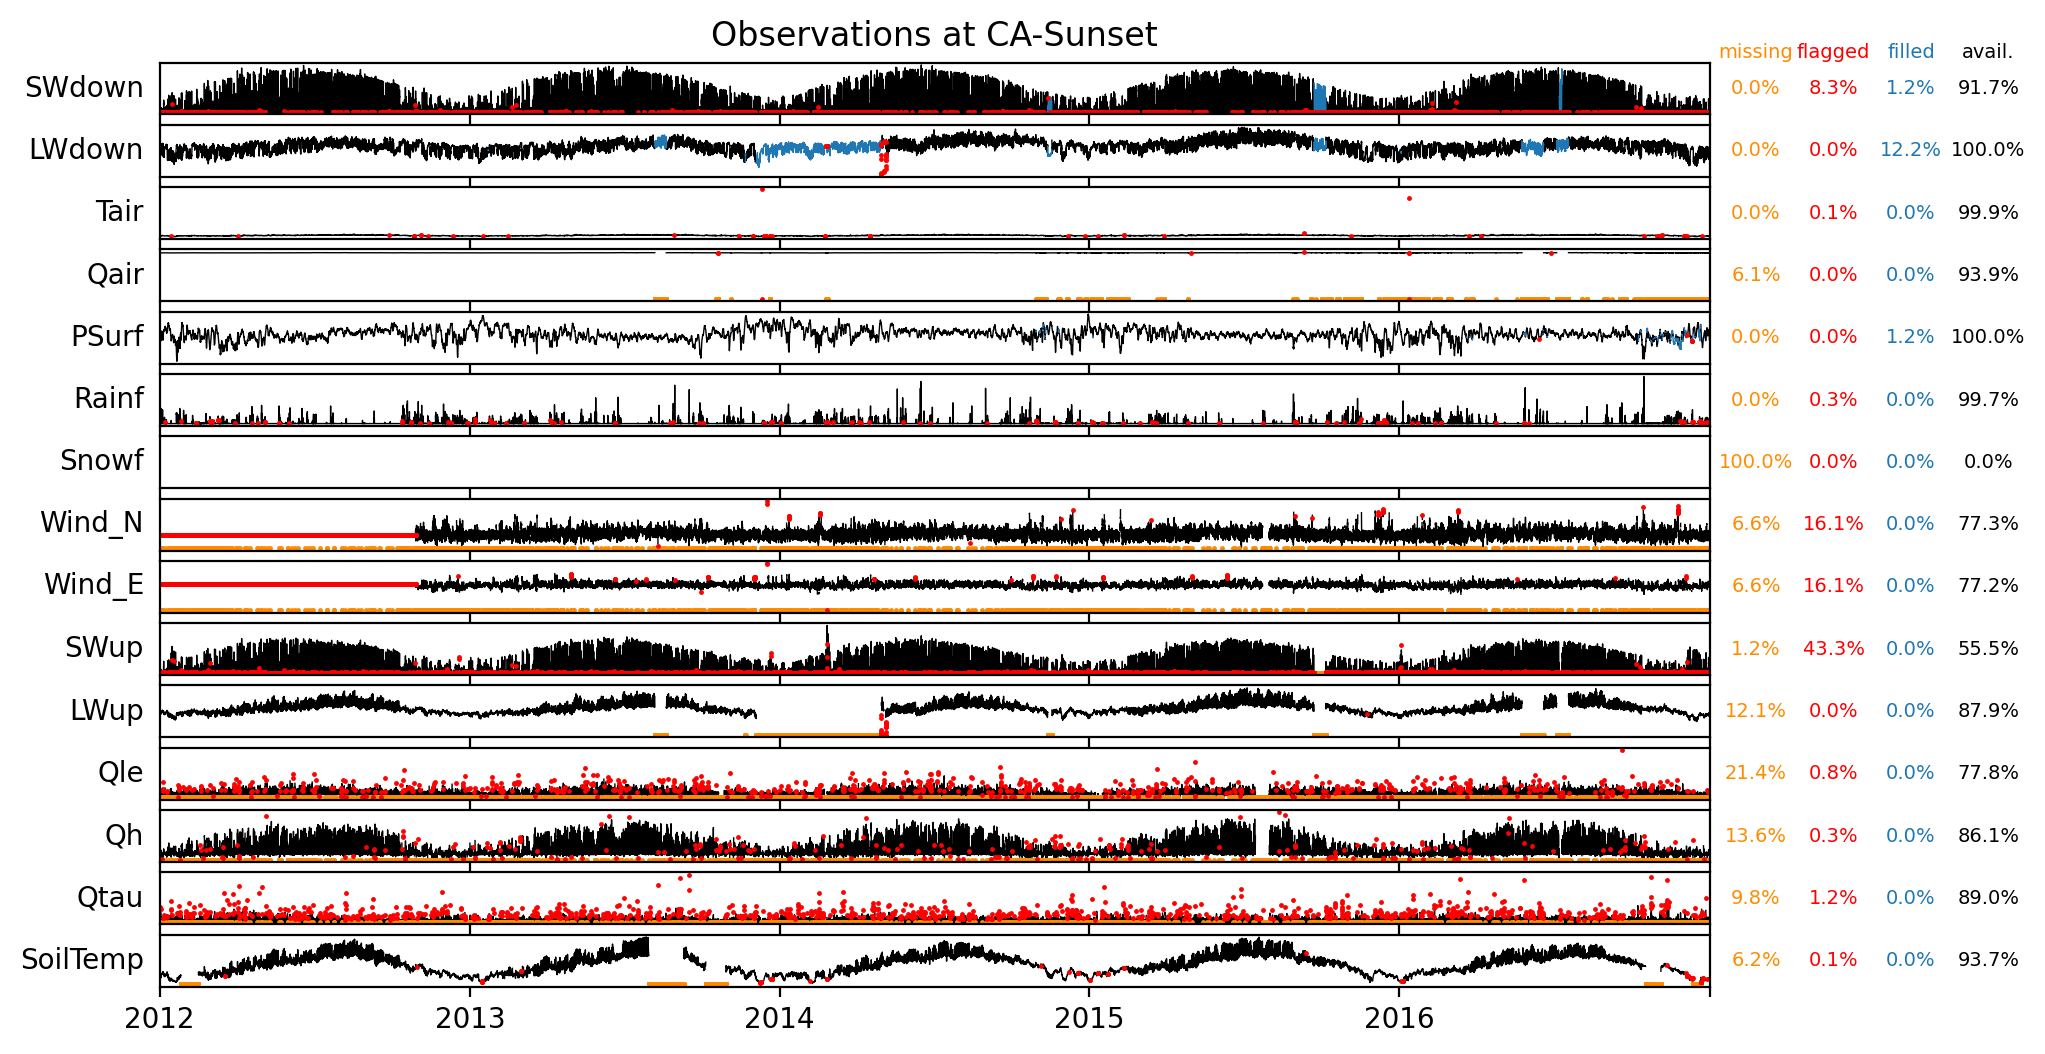
Observations (before additional gap filling)
Site forcing metadata
| observation_attributes | |
|---|---|
| title | Continuous meterological forcing from CA-Sunset |
| summary | Flux tower observations from Sunset, Vancouver, Canada after quality control, with gap filling from bias corrected ERA5 surface meteorological data. Developed for use in the Urban-PLUMBER model evaluation project. Attribute any use to “Harmonized, gap-filled dataset from 20 urban flux tower sites” |
| sitename | CA-Sunset |
| long_sitename | Sunset, Vancouver, Canada |
| version | v1 |
| keywords | urban, flux tower, eddy covariance, observations |
| conventions | ALMA, CF, ACDD-1.3 |
| featureType | timeSeries |
| license | CC-BY-4.0: https://creativecommons.org/licenses/by/4.0/ |
| time_coverage_start | 2002-01-01 00:00:00 |
| time_coverage_end | 2016-12-31 23:30:00 |
| time_analysis_start | 2012-01-01 00:00:00 |
| time_shown_in | UTC |
| local_utc_offset_hours | -8.0 |
| timestep_interval_seconds | 1800.0 |
| timestep_number_spinup | 175296 |
| timestep_number_analysis | 87696 |
| project | Urban-PLUMBER multi-site model evaluation project for urban areas |
| references | Data from “Harmonized gap-filled dataset from 20 urban flux tower sites”: https://doi.org/10.5281/zenodo.5517550 |
| project_contact | Mathew Lipson (m.lipson@unsw.edu.au), Sue Grimmond (c.s.grimmond@reading.ac.uk), Martin Best (martin.best@metoffice.gov.uk) |
| observations_contact | Andreas Christen (andreas.christen@meteo.uni-freiburg.de) Albert-Ludwigs-Universitaet Freiburg |
| observations_reference | Christen, Coops, Crawford, Kellett, Liss, Olchovski, Tooke, van der Laan, Voogt (2011): https://doi.org/10.1016/j.atmosenv.2011.07.040; Crawford and Christen (2015): https://doi.org/10.1007/s00704-014-1124-0 |
| date_created | 2022-09-22 15:05:48 |
| source | https://github.com/matlipson/urban-plumber_pipeline |
| other_references | ERA5: Copernicus Climate Change Service (C3S) (2017): https://cds.climate.copernicus.eu/cdsapp#!/home NCI Australia: http://doi.org/10.25914/5f48874388857 |
| acknowledgements | Contains modified Copernicus Climate Change Service Information 2021 (ERA5 hourly data on single levels). Data from replica hosted by NCI Australia. |
| comment | Gapfilling for SWdown, LWdown, PSurf by Oliver Michels based on local observations and regressions. SoilTemp at 5cm depth. |
| history | v0.9 (2021-09-08): beta issue; v1 (2022-09-15): with publication in ESSD |
Site images
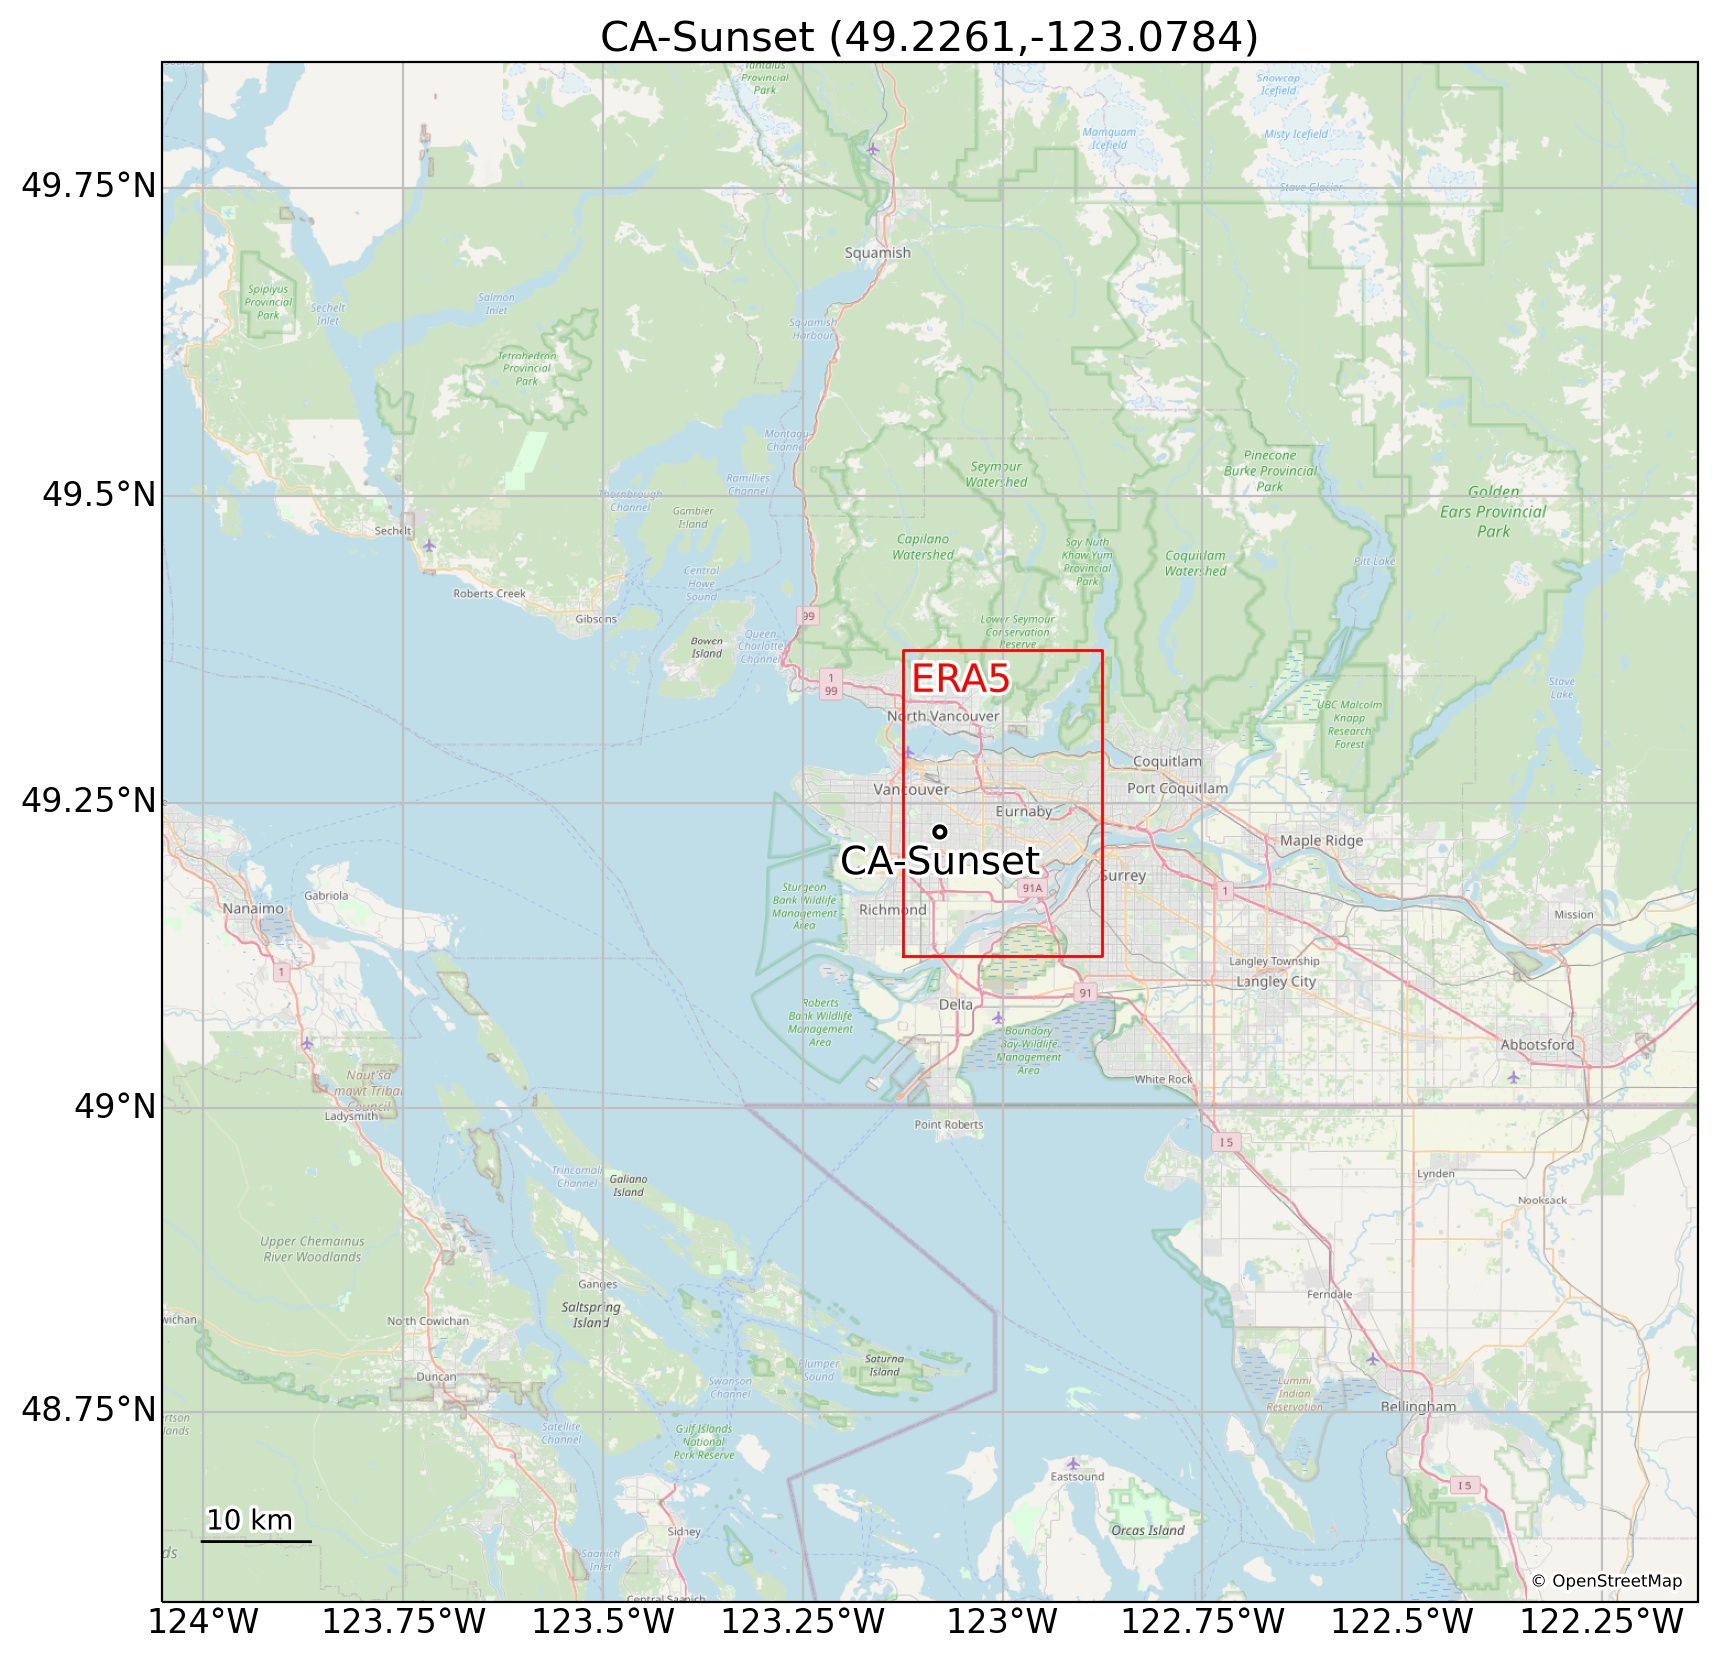 Regional map. © OpenStreetMap Regional map. © OpenStreetMap |
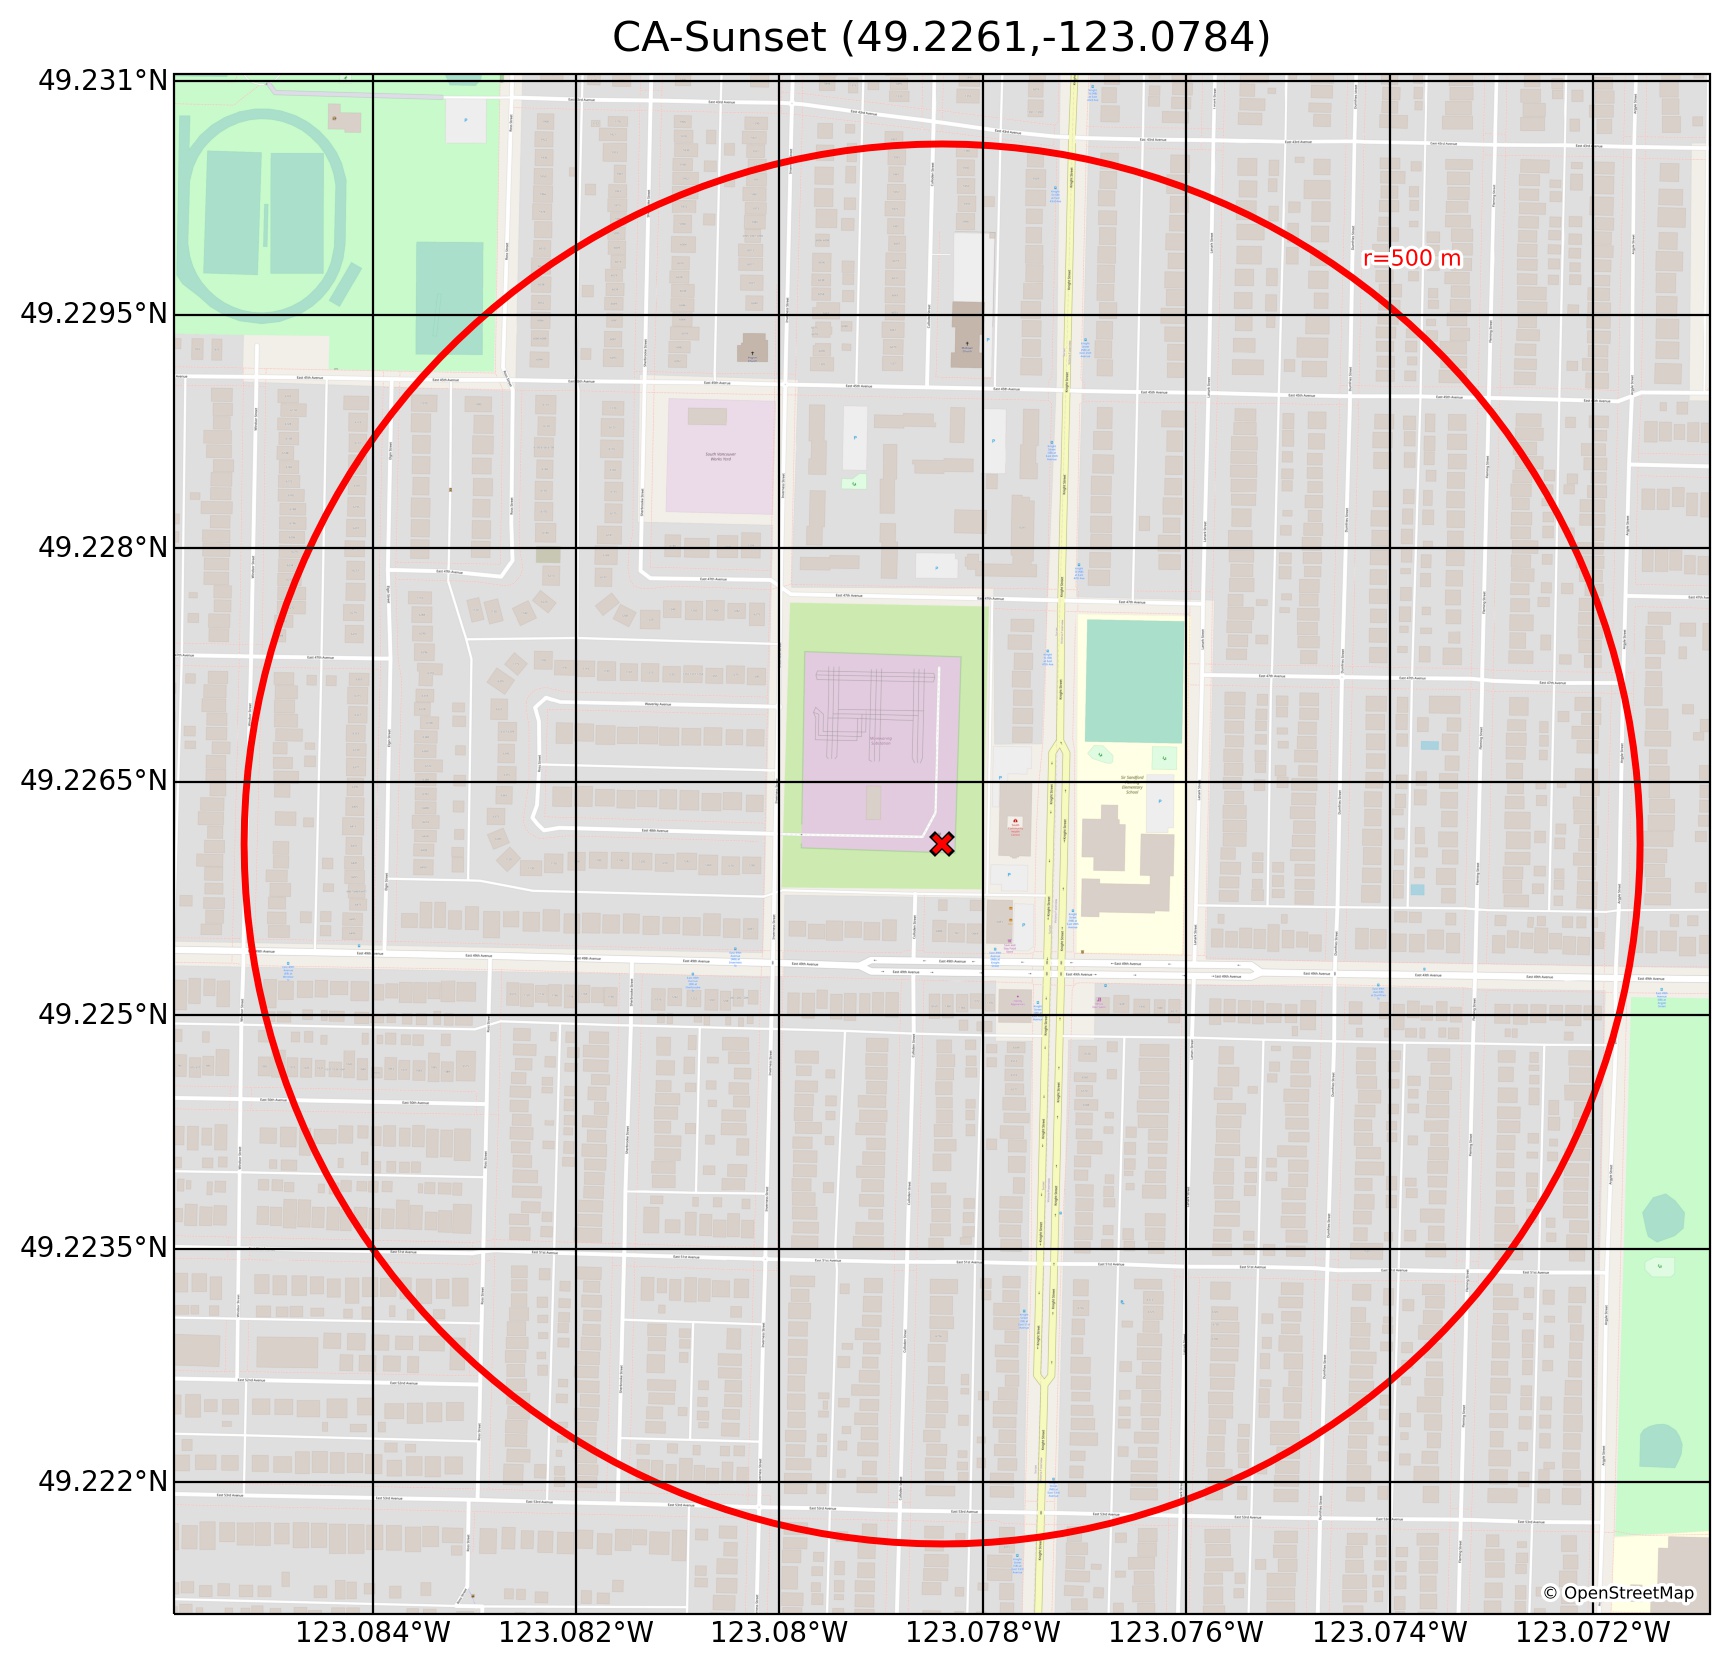 Site map with 500 m radius. © OpenStreetMap Site map with 500 m radius. © OpenStreetMap |
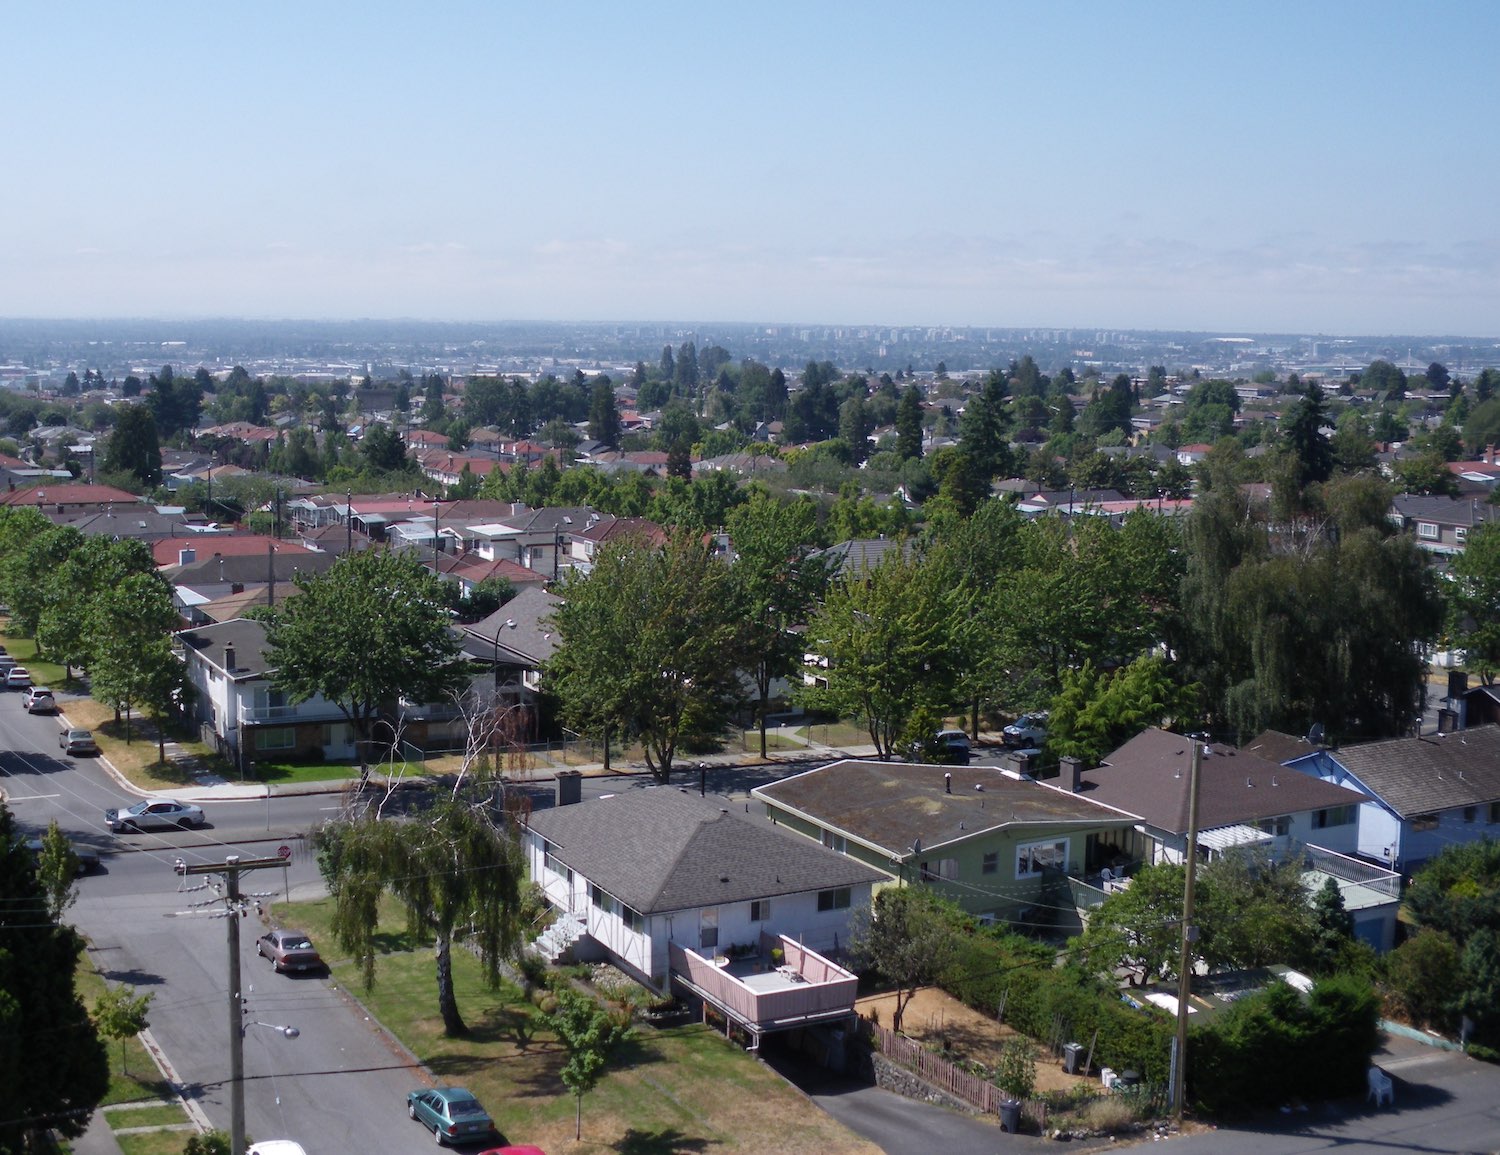 Site photo. © A. Christen Site photo. © A. Christen |
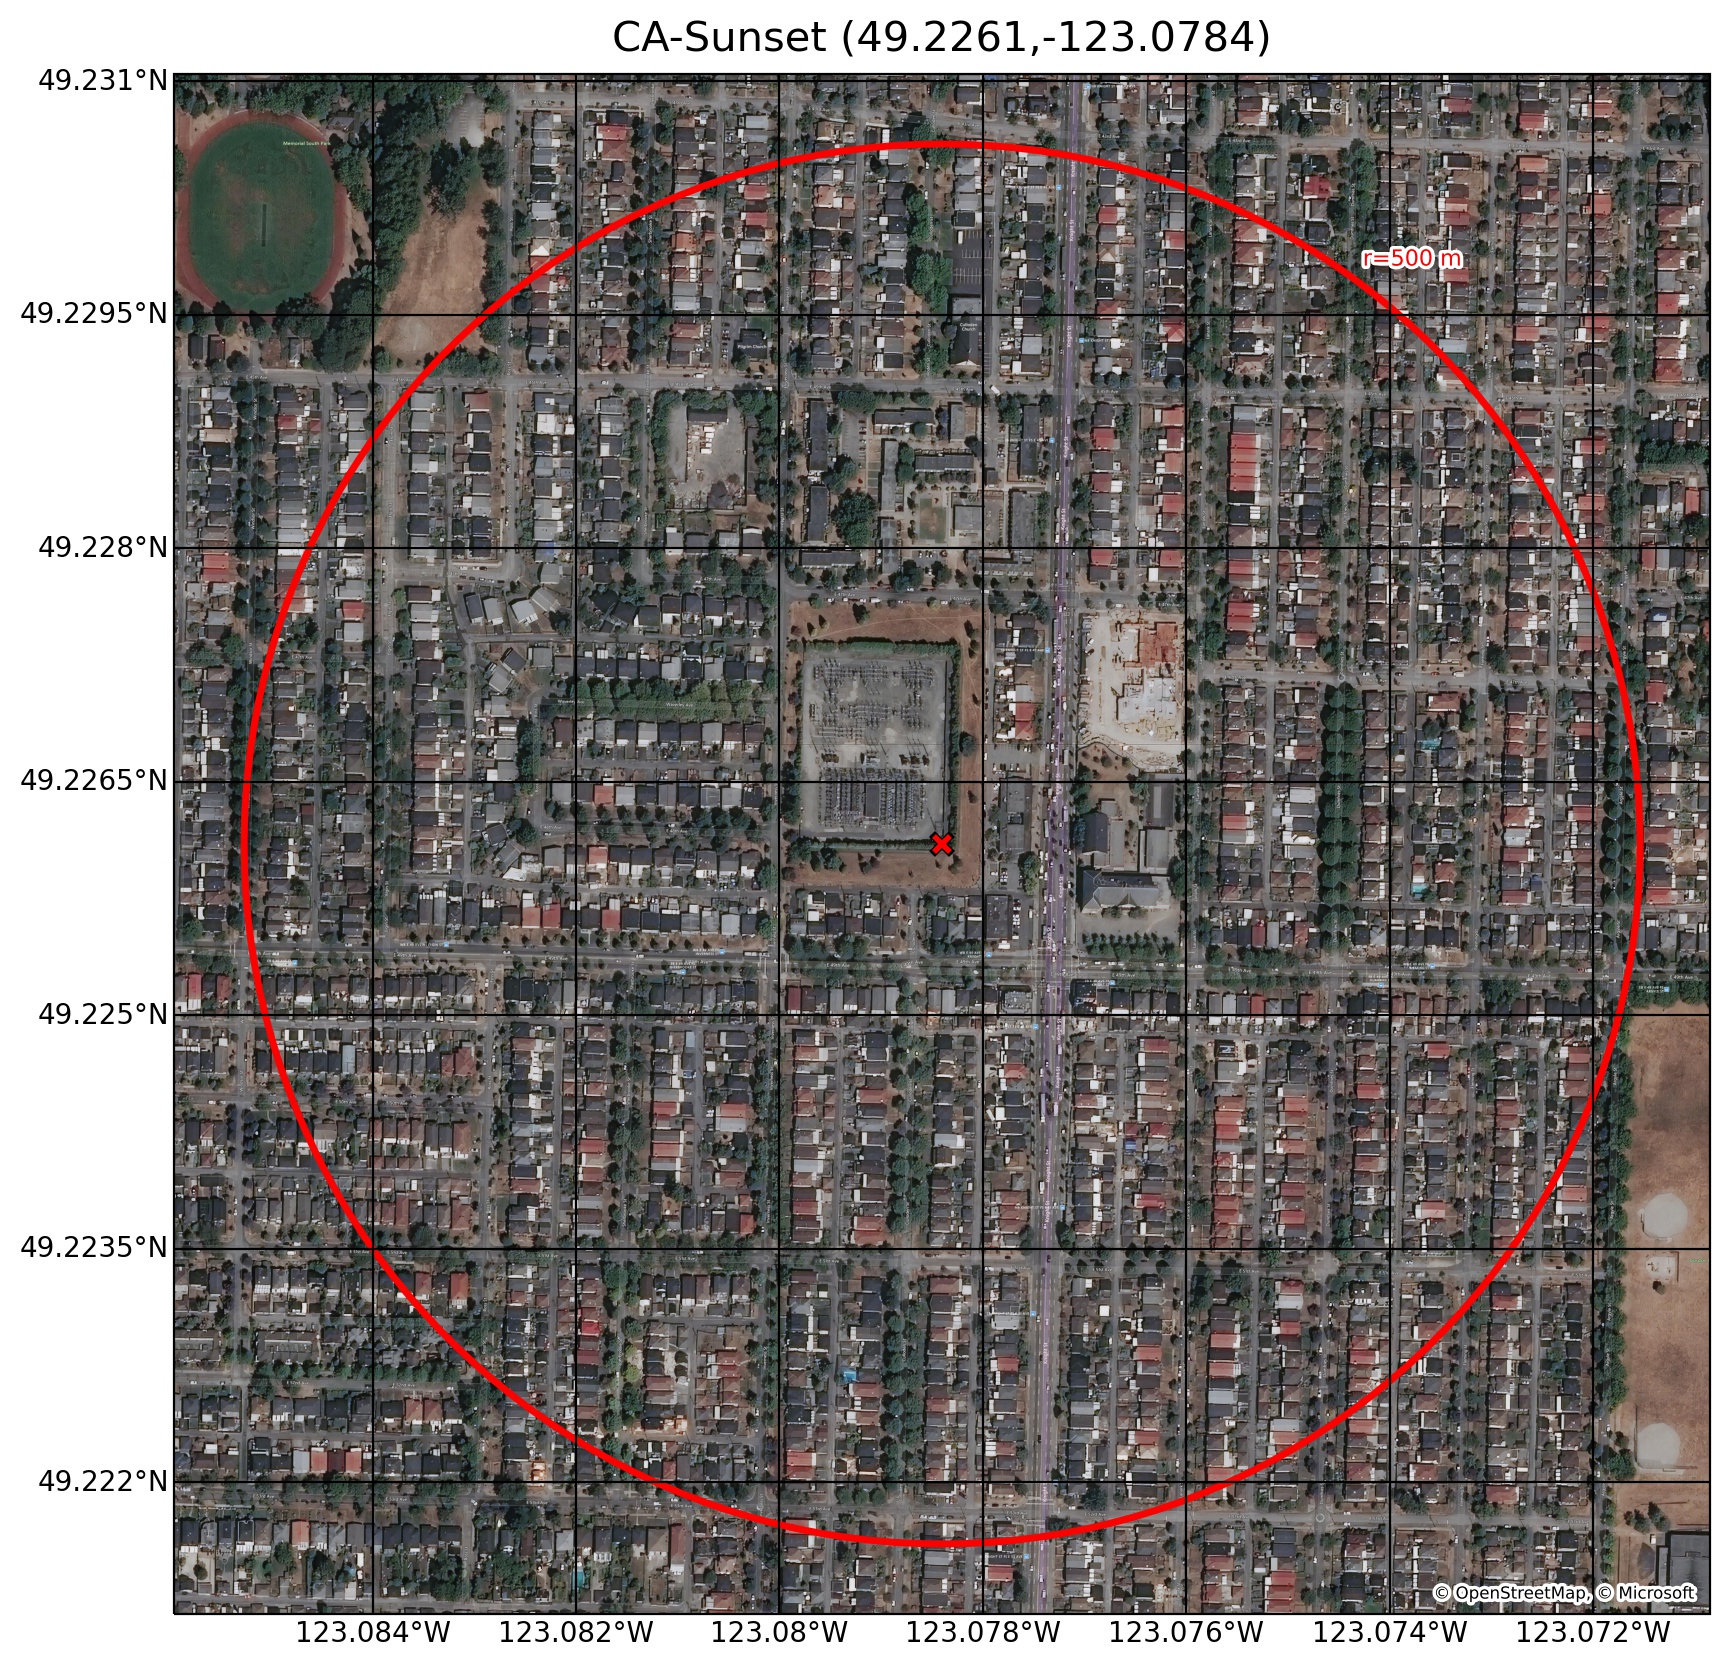 Site aerial photo with 500 m radius. © OpenStreetMap, Microsoft Site aerial photo with 500 m radius. © OpenStreetMap, Microsoft |
Maps developed from: Hrisko, J. (2020). Geographic Visualizations in Python with Cartopy. Maker Portal.
Site characteristics
| id | parameter | value | units | source | doi |
|---|---|---|---|---|---|
| 1 | latitude | 49.2261 | degrees_north | Christen et al. (website) | https://ibis.geog.ubc.ca/~achristn/infrastructure/sunset.html |
| 2 | longitude | -123.078 | degrees_east | Christen et al. (website) | https://ibis.geog.ubc.ca/~achristn/infrastructure/sunset.html |
| 3 | ground_height | 78 | m | Chirsten, pers. comms. | - |
| 4 | measurement_height_above_ground | 24.8 | m | Crawford and Christen 2015 | https://doi.org/10.1007/s00704-014-1124-0 |
| 5 | impervious_area_fraction | 0.68 | 1 | Christen et al. (website) | https://ibis.geog.ubc.ca/~achristn/infrastructure/sunset.html |
| 6 | tree_area_fraction | 0.12 | 1 | Christen et al. (website) | https://ibis.geog.ubc.ca/~achristn/infrastructure/sunset.html |
| 7 | grass_area_fraction | 0.2 | 1 | Christen et al. (website) | https://ibis.geog.ubc.ca/~achristn/infrastructure/sunset.html |
| 8 | bare_soil_area_fraction | 0 | 1 | Christen et al. (website) | https://ibis.geog.ubc.ca/~achristn/infrastructure/sunset.html |
| 9 | water_area_fraction | 0 | 1 | Christen et al. (website) | https://ibis.geog.ubc.ca/~achristn/infrastructure/sunset.html |
| 10 | roof_area_fraction | 0.23 | 1 | Christen et al. (website) | https://ibis.geog.ubc.ca/~achristn/infrastructure/sunset.html |
| 11 | road_area_fraction | 0.2 | 1 | estimated, see notes | derived from 0.45 total plan area of impervious ground (roads and paving) from tower website, and the proportion of road in impervious area from Crawford and Christen (2015) |
| 12 | other_paved_area_fraction | 0.25 | 1 | estimated, see notes | derived from 0.45 total plan area of impervious ground (roads and paving) from tower website, and the proportion of road in impervious area from Crawford and Christen (2015) |
| 13 | building_mean_height | 4.9 | m | Christen et al. (website) | https://ibis.geog.ubc.ca/~achristn/infrastructure/sunset.html |
| 14 | tree_mean_height | 9 | m | Crawford and Christen 2015 | https://doi.org/10.1007/s00704-014-1124-0 |
| 15 | roughness_length_momentum | 1.7 | m | Crawford and Christen 2015 (morphometric method) | https://doi.org/10.1007/s00704-014-1124-0 |
| 16 | displacement_height | 2.6 | m | Crawford and Christen 2015 (morphometric method) | https://doi.org/10.1007/s00704-014-1124-0 |
| 17 | canyon_height_width_ratio | 0.15 | 1 | estimated, see notes | estimate from inspection of typical width between buildings (~32m) and building mean height (4.9) |
| 18 | wall_to_plan_area_ratio | 0.18 | 1 | estimated, see notes | derived from Table 9 of van der Laan (2012) using mean building footprint and height, assuming square geometry of buildings |
| 19 | average_albedo_at_midday | 0.107 | 1 | median of observations | - |
| 20 | resident_population_density | 6410 | person/km2 | Christen et al. (website) | https://ibis.geog.ubc.ca/~achristn/infrastructure/sunset.html |
| 21 | anthropogenic_heat_flux_mean | 12.8 | W/m2 | Christen et al. 2011 | https://doi.org/10.13140/RG.2.1.2862.4889 |
| 22 | topsoil_clay_fraction | 0.18 | 1 | OpenLandMap | https://doi.org/10.5281/zenodo.2525663 |
| 23 | topsoil_sand_fraction | 0.44 | 1 | OpenLandMap | https://doi.org/10.5281/zenodo.2525662 |
| 24 | topsoil_bulk_density | 940 | kg/m3 | Christen et al. 2013 | https://doi.org/10.14288/1.0103594 |
| 25 | building_height_standard_deviation | 1.74 | m | van der Laan et al. 2012 | https://doi.org/10.14288/1.0103592 |
| 26 | roughness_length_momentum_mac | 0.14 | m | Macdonald method | derived from morphology using eq. 26 of Macdonald et al. (1998) |
| 27 | displacement_height_mac | 2.22 | m | Macdonald method | derived from morphology using eq. 23 of Macdonald et al. (1998) |
| 28 | roughness_length_momentum_kanda | 0.11 | m | Kanda method | derived from morphology using eq. 12a of Kanda et al. (2013) |
| 29 | displacement_height_kanda | 5.18 | m | Kanda method | derived from morphology using eq. 10a of Kanda et al. (2013) |
Site forcing
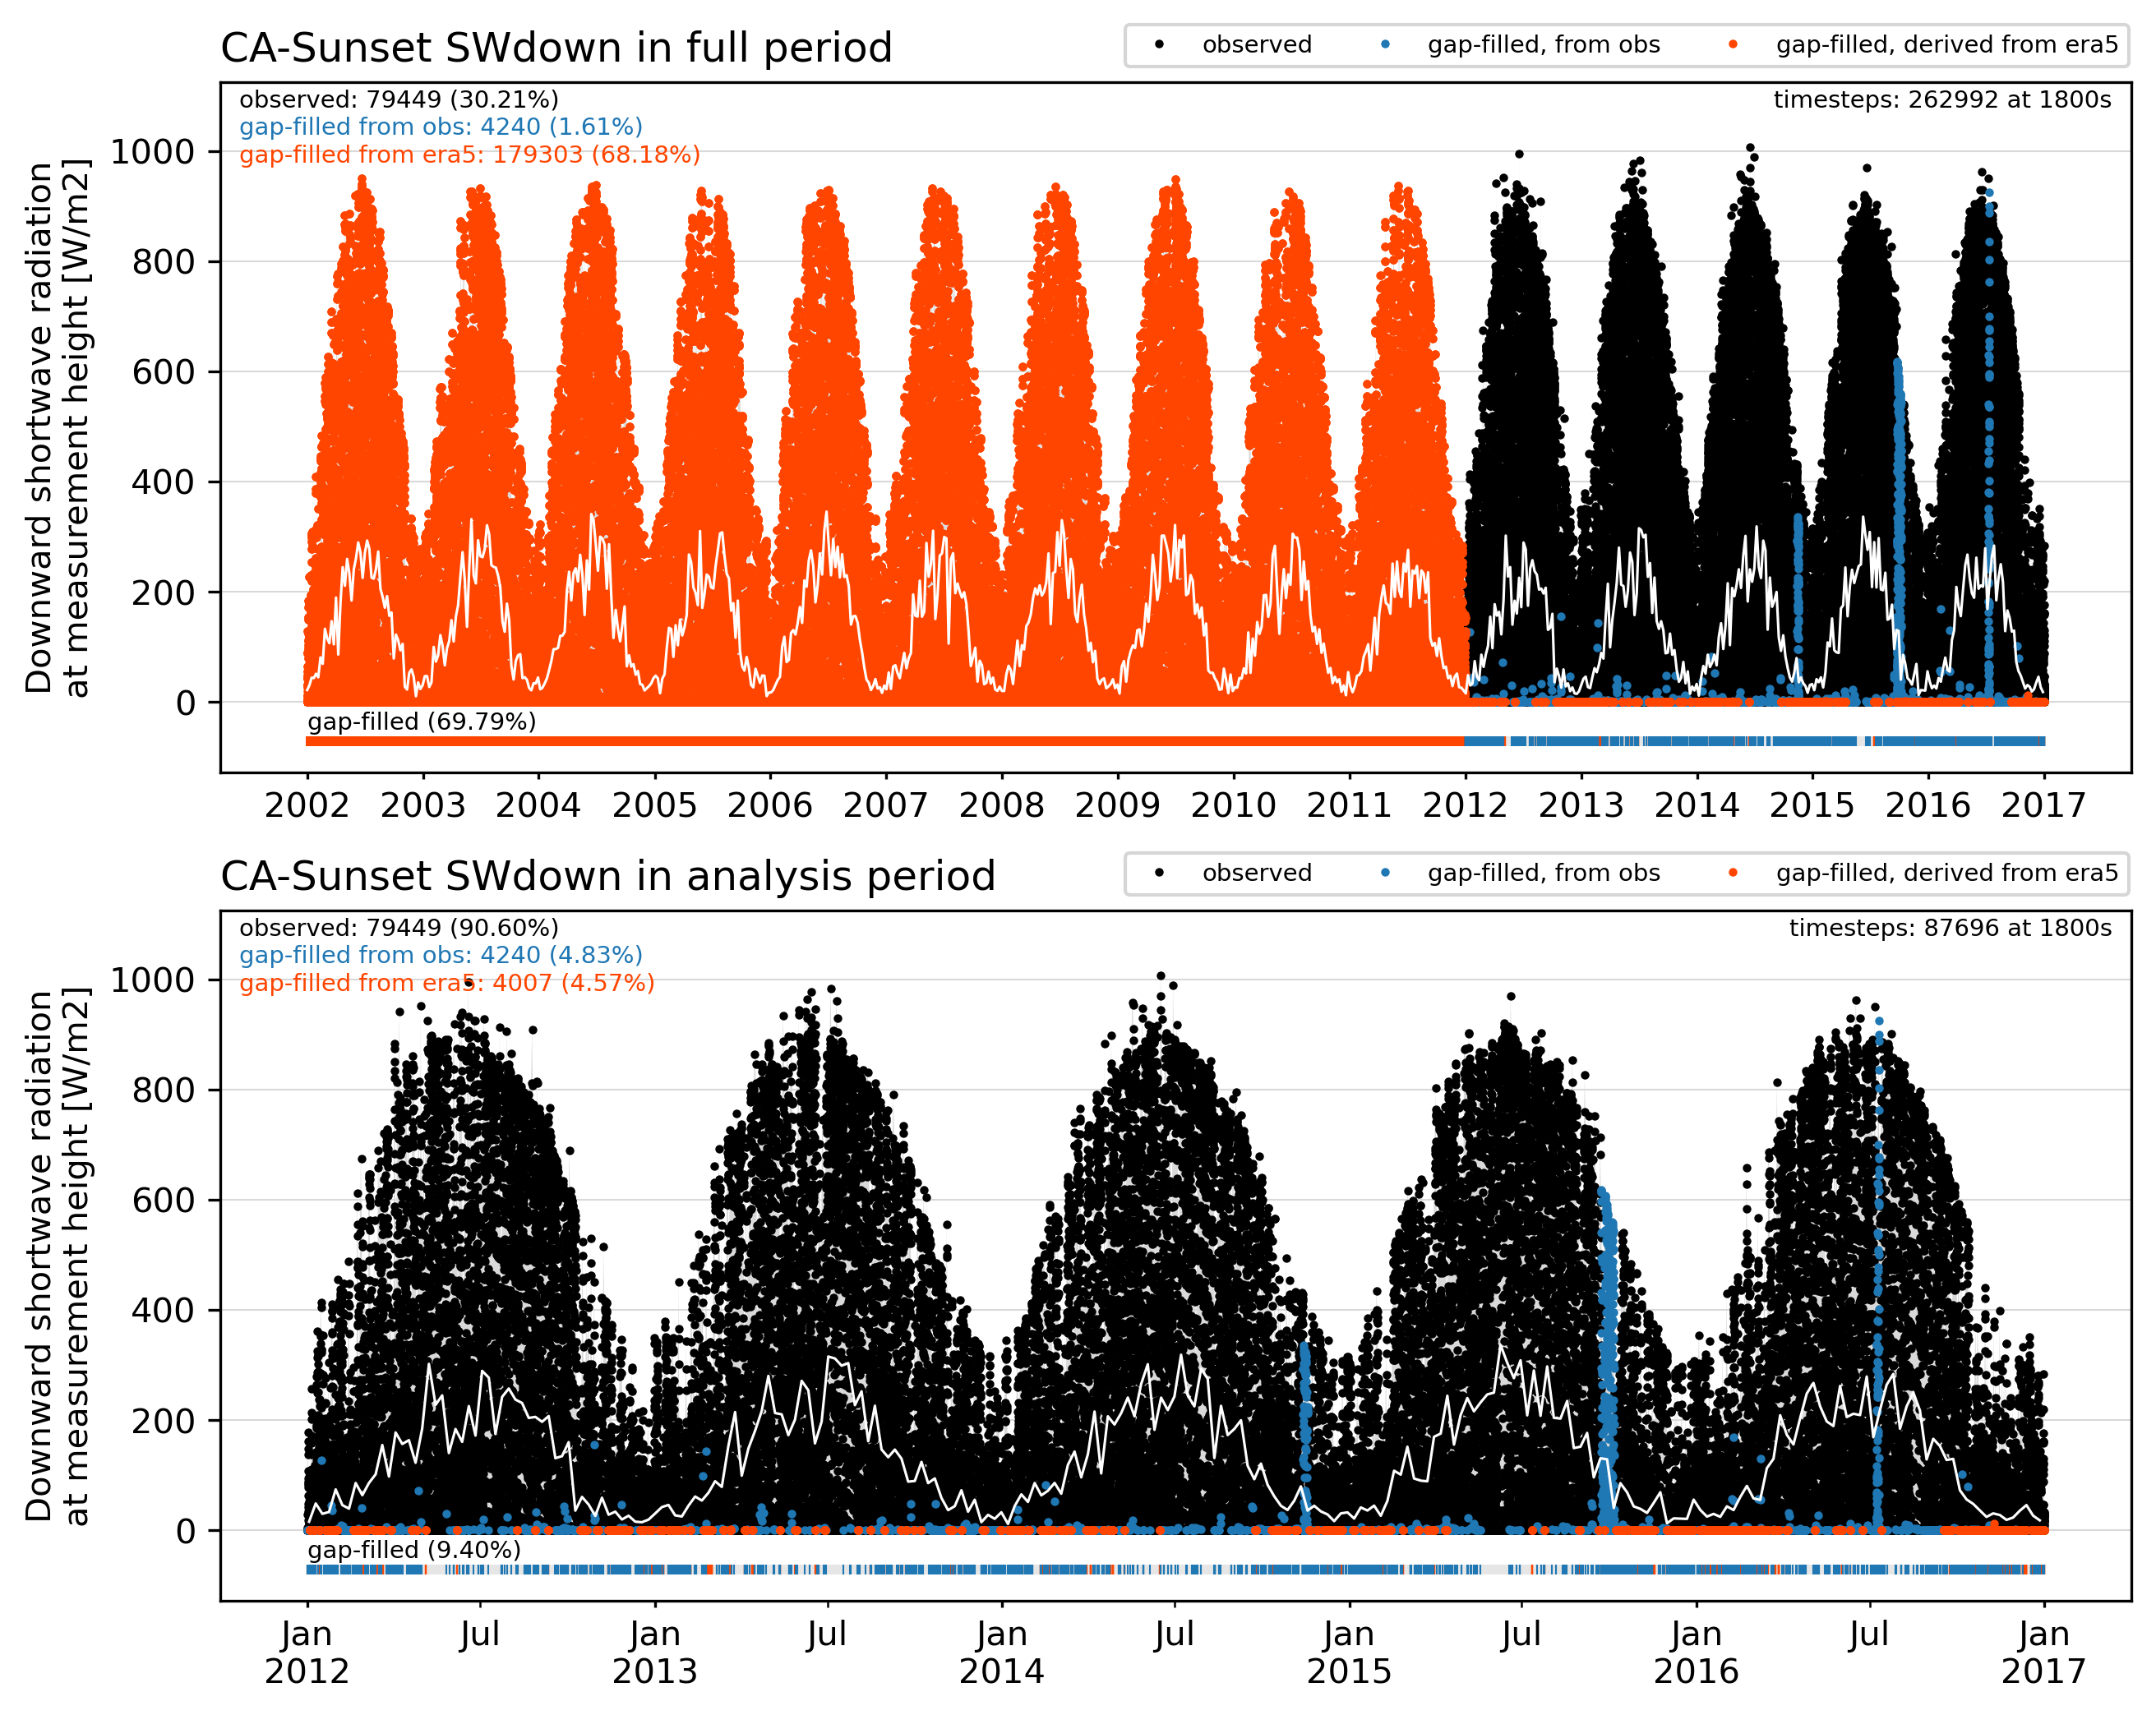
SWdown forcing
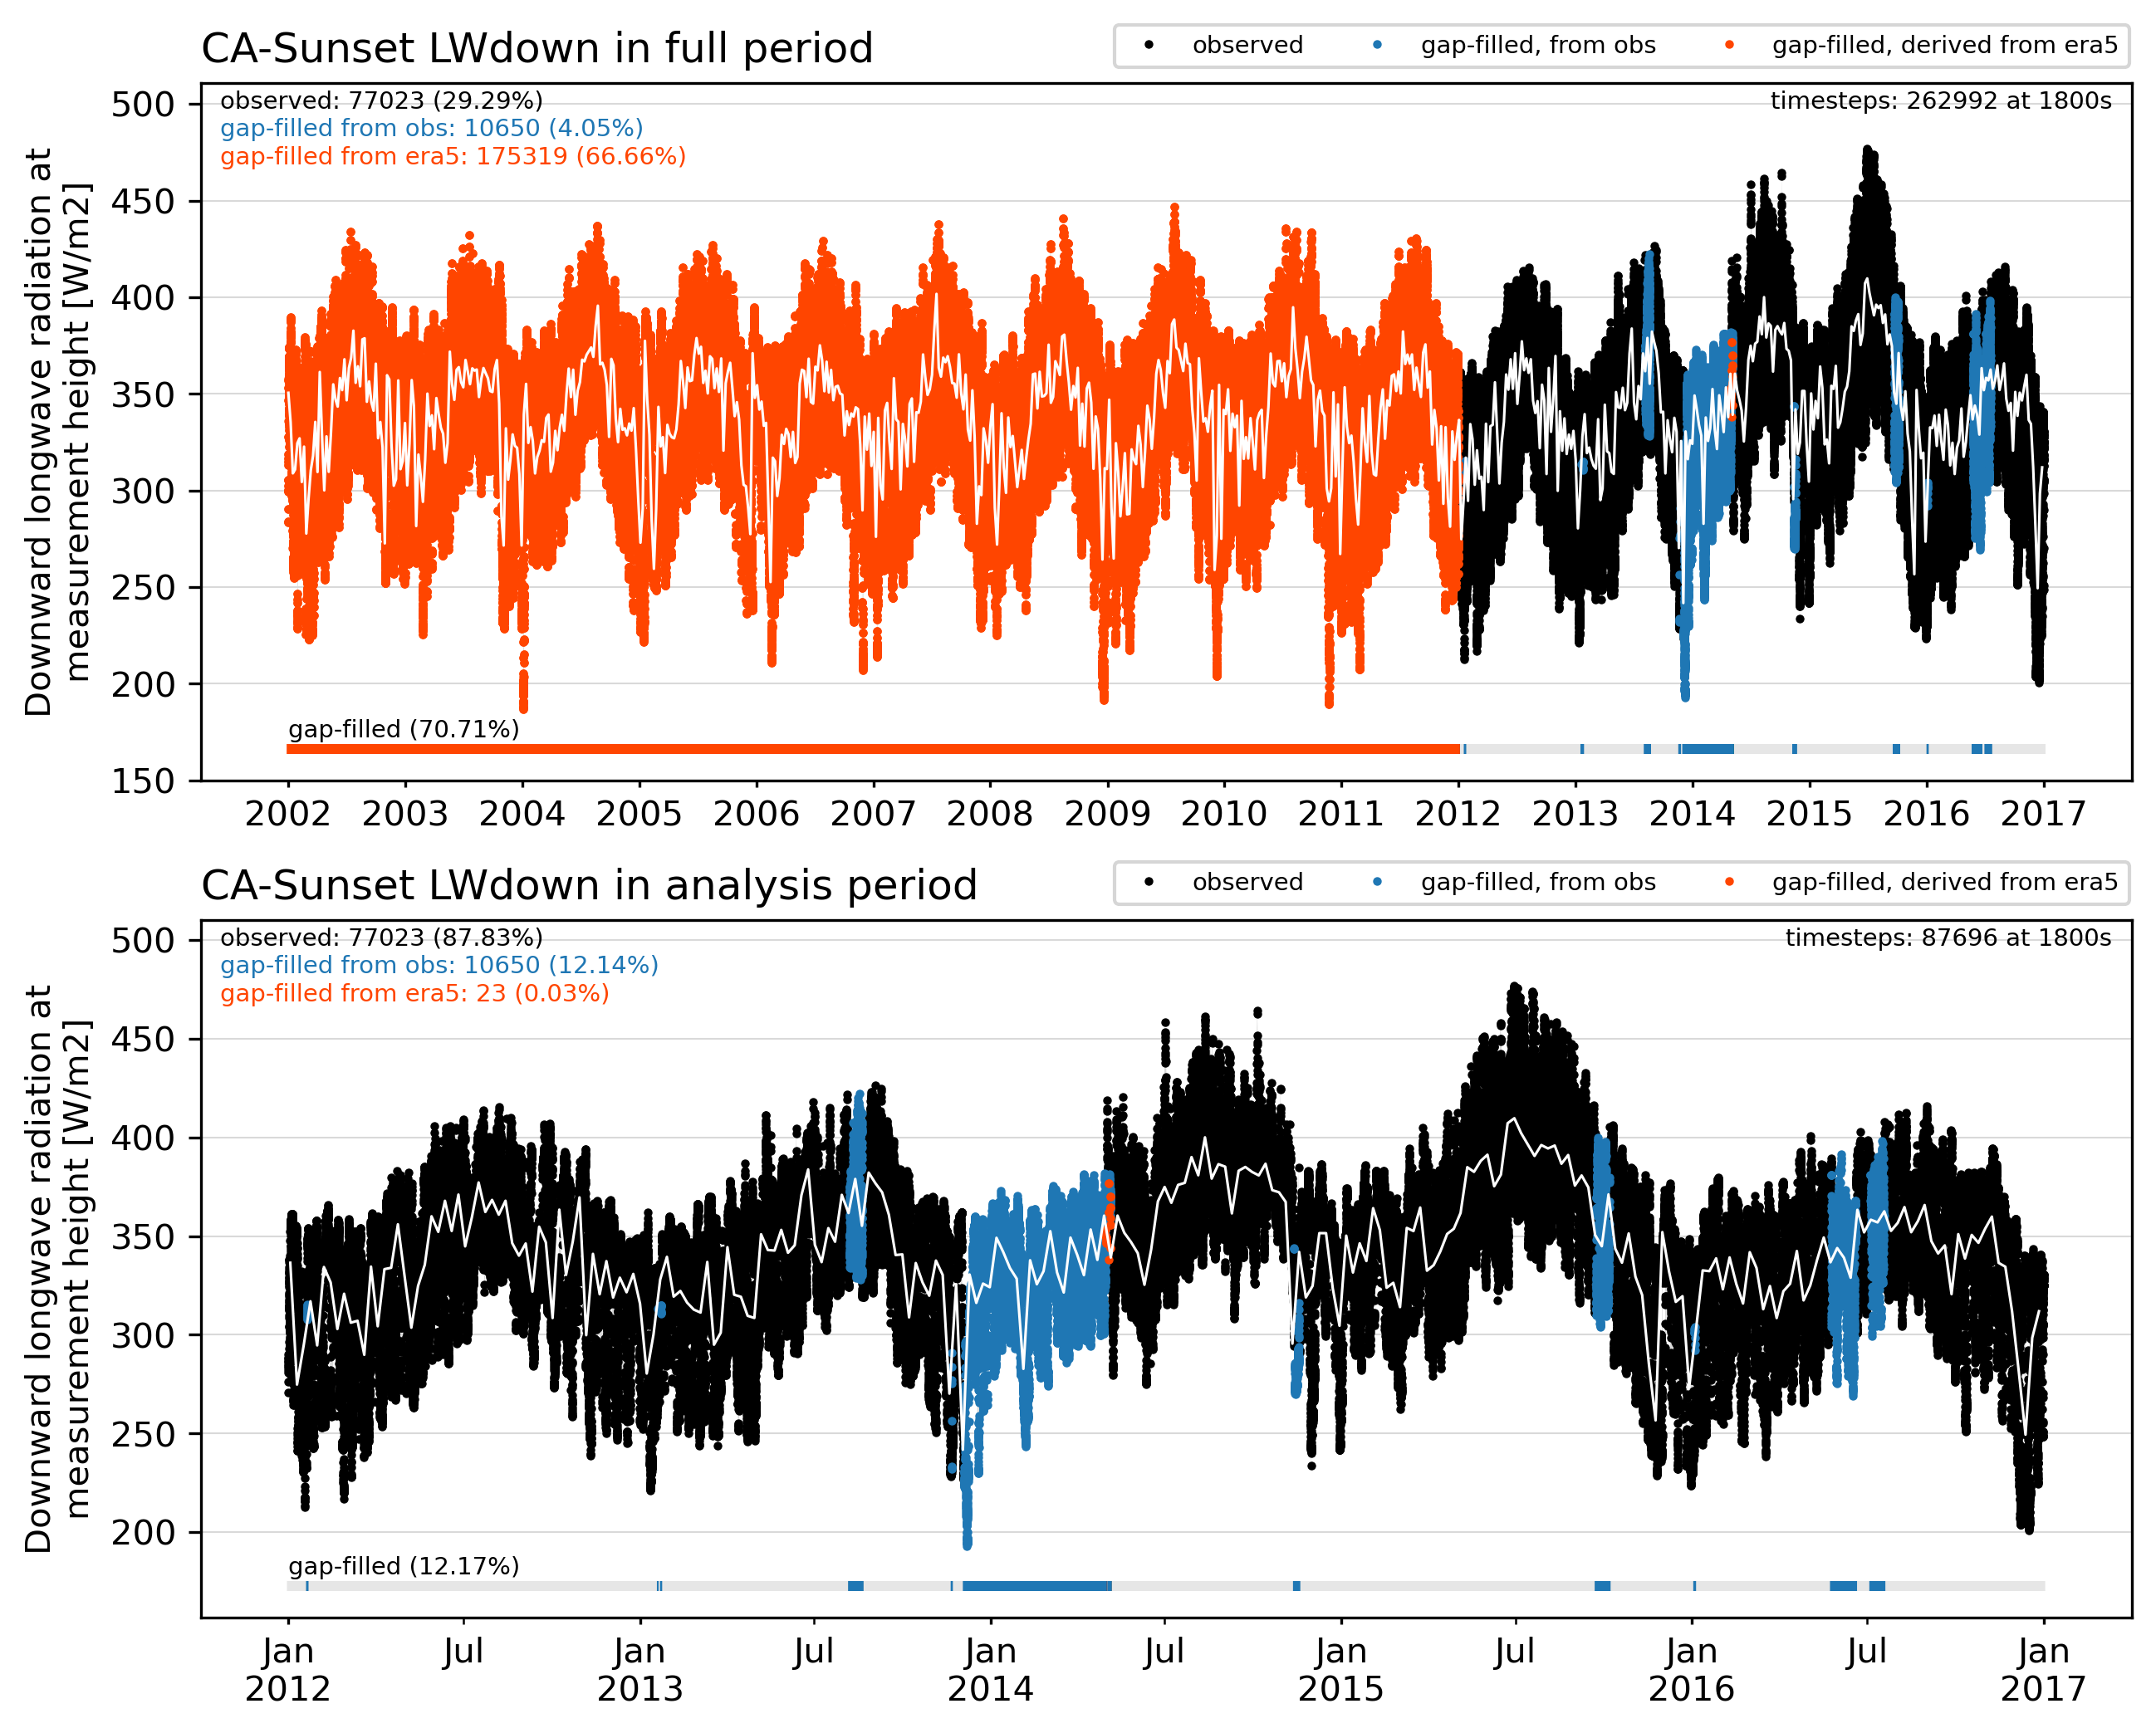
LWdown forcing
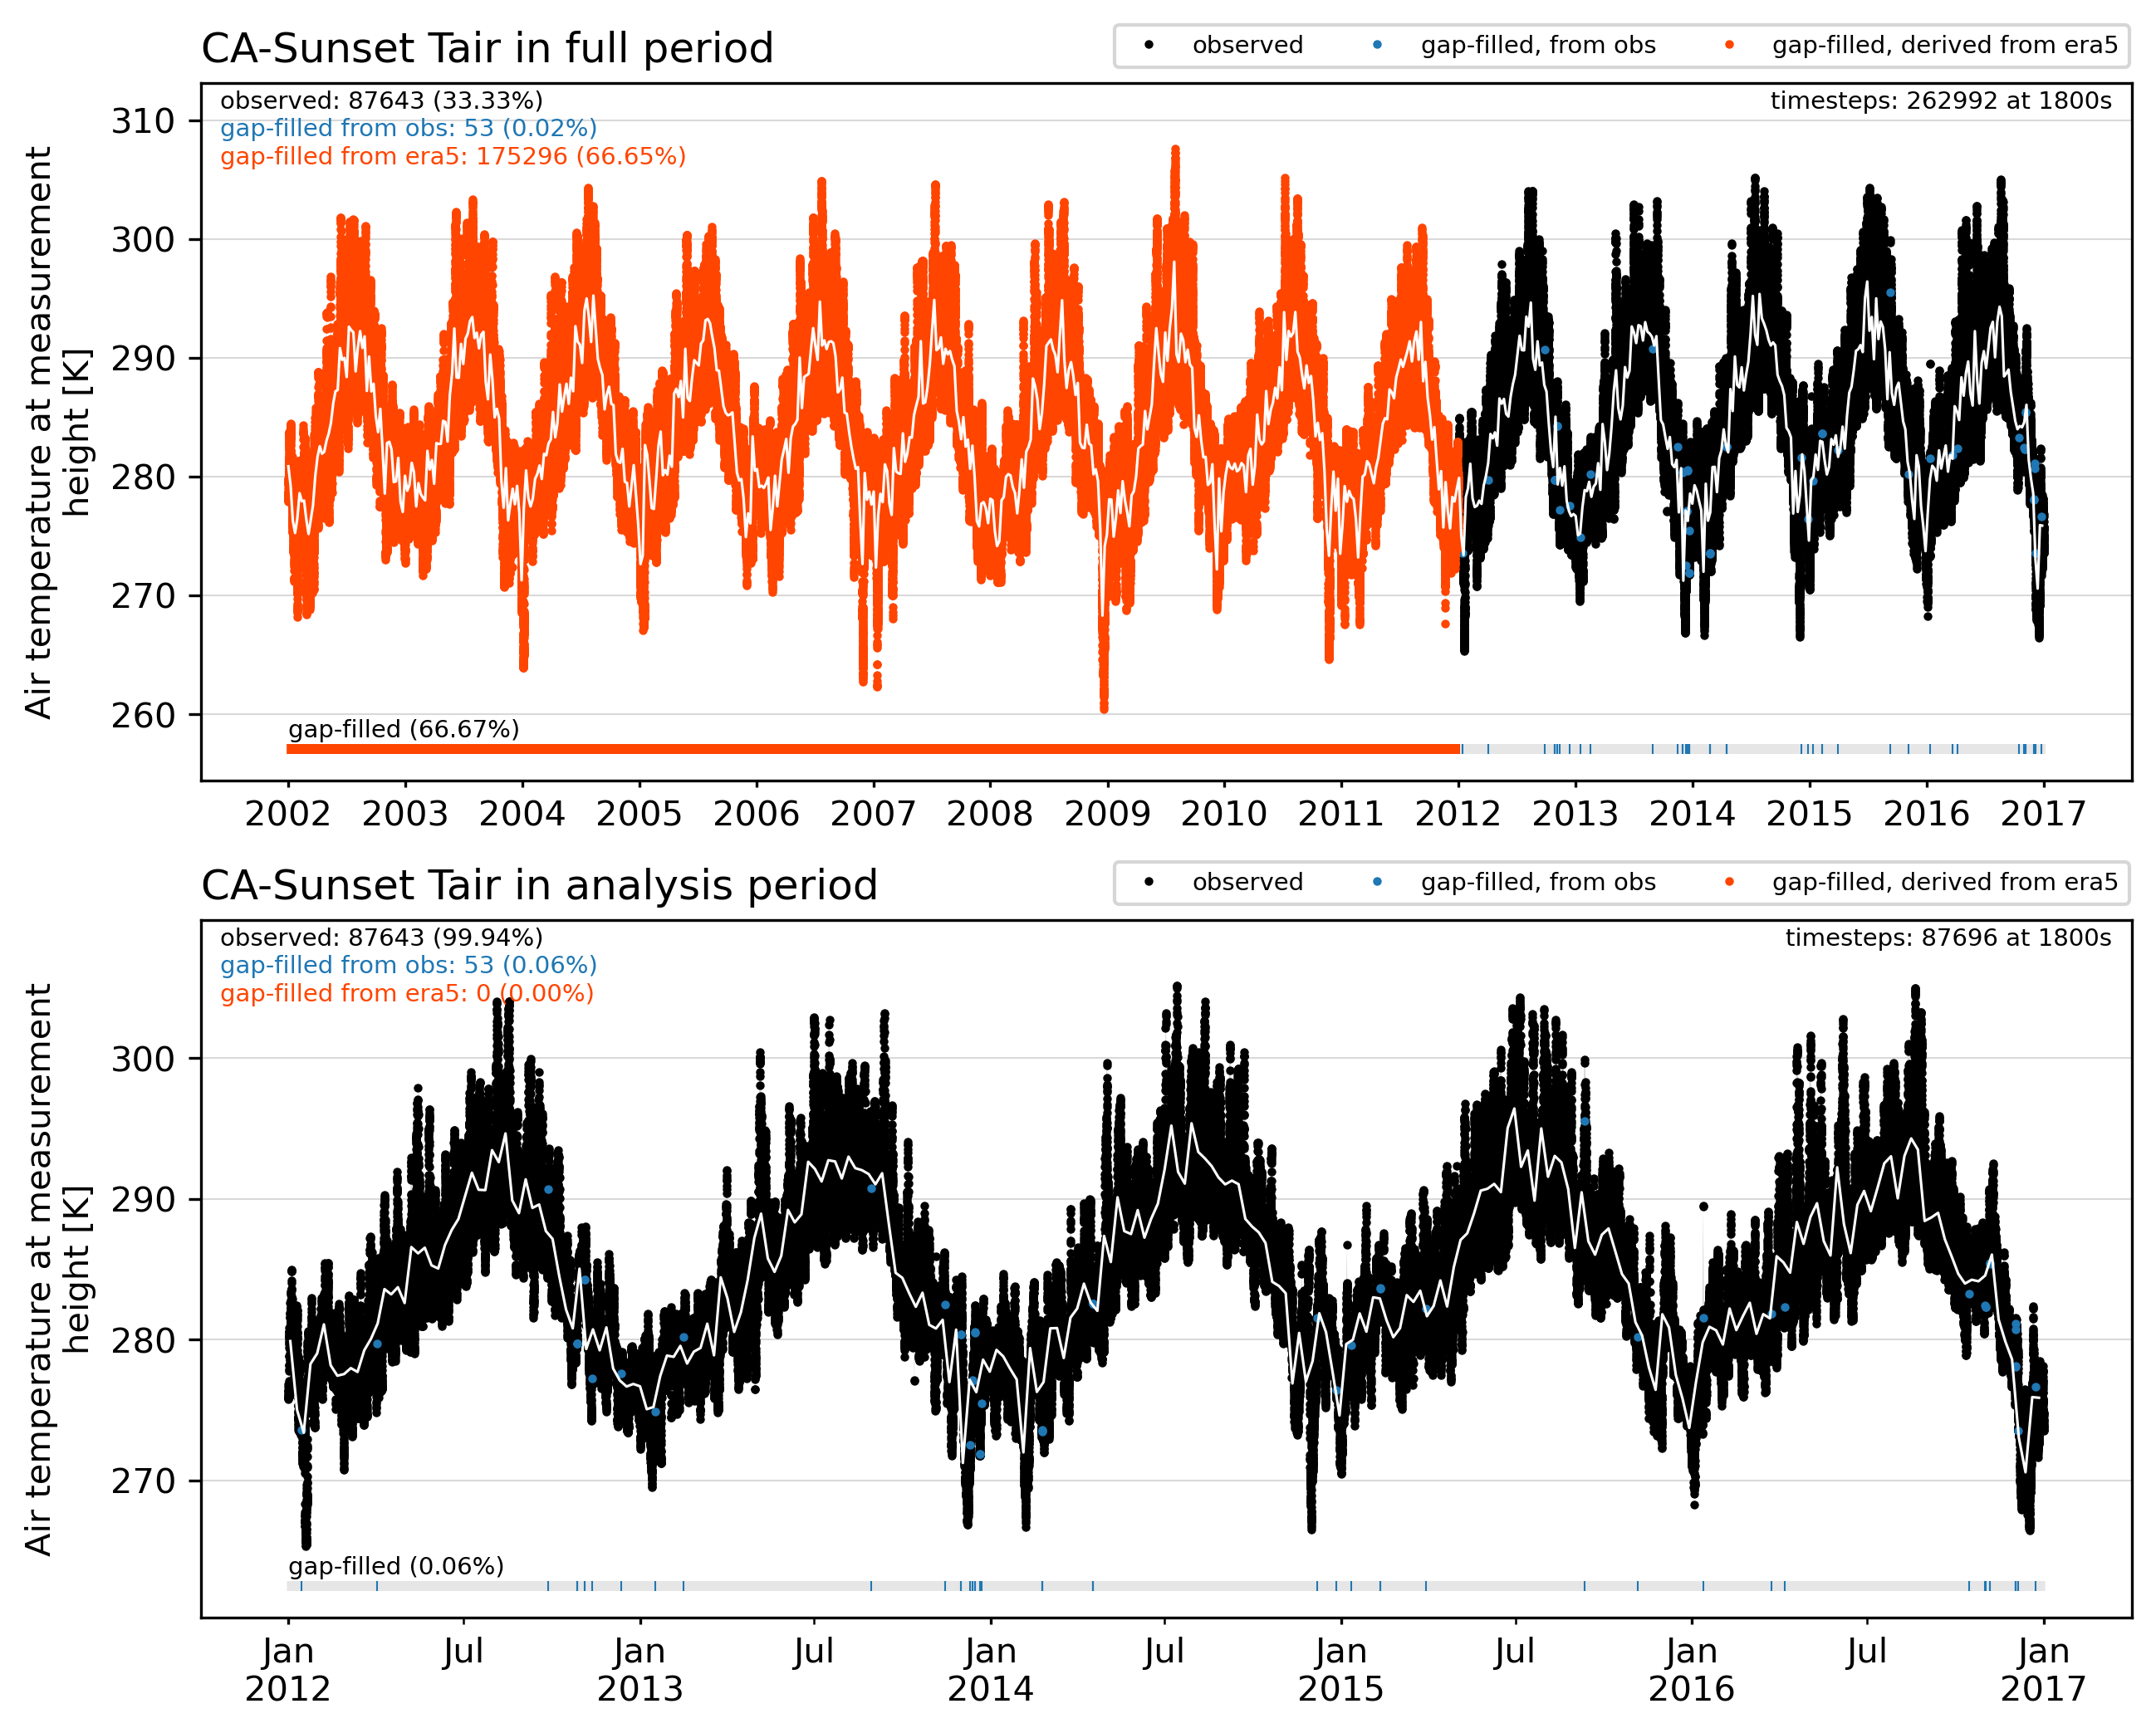
Tair forcing
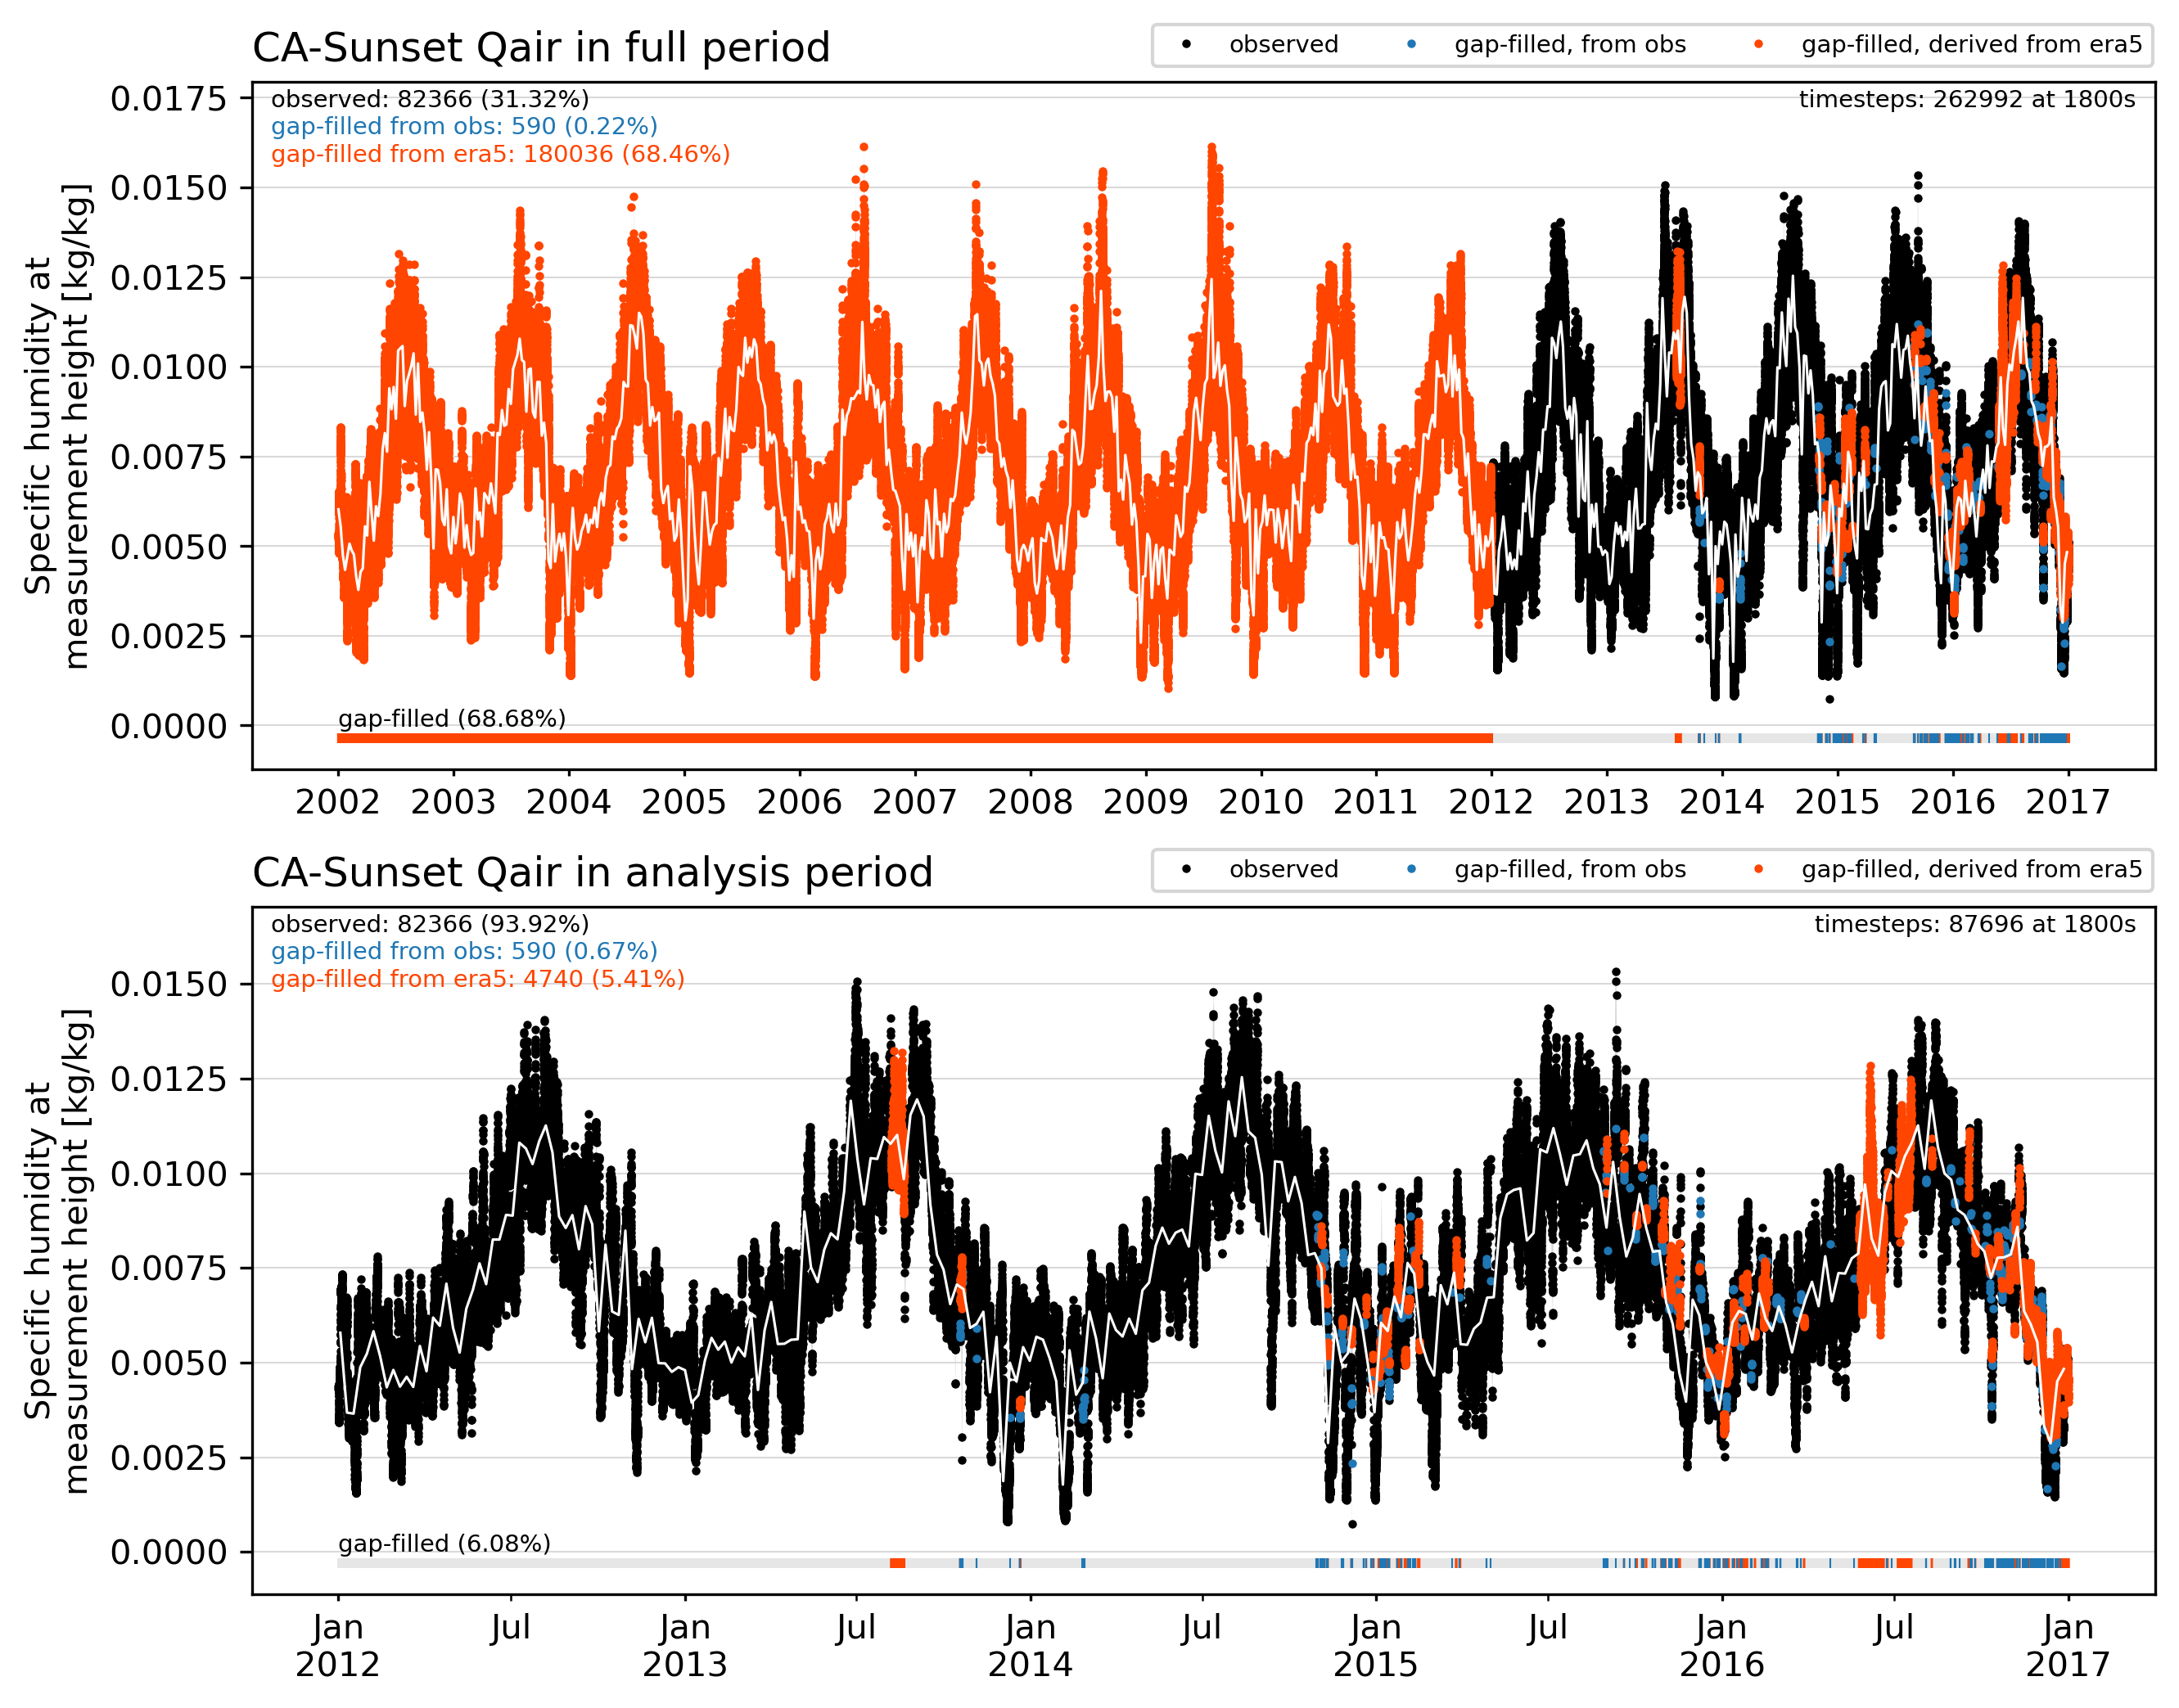
Qair forcing
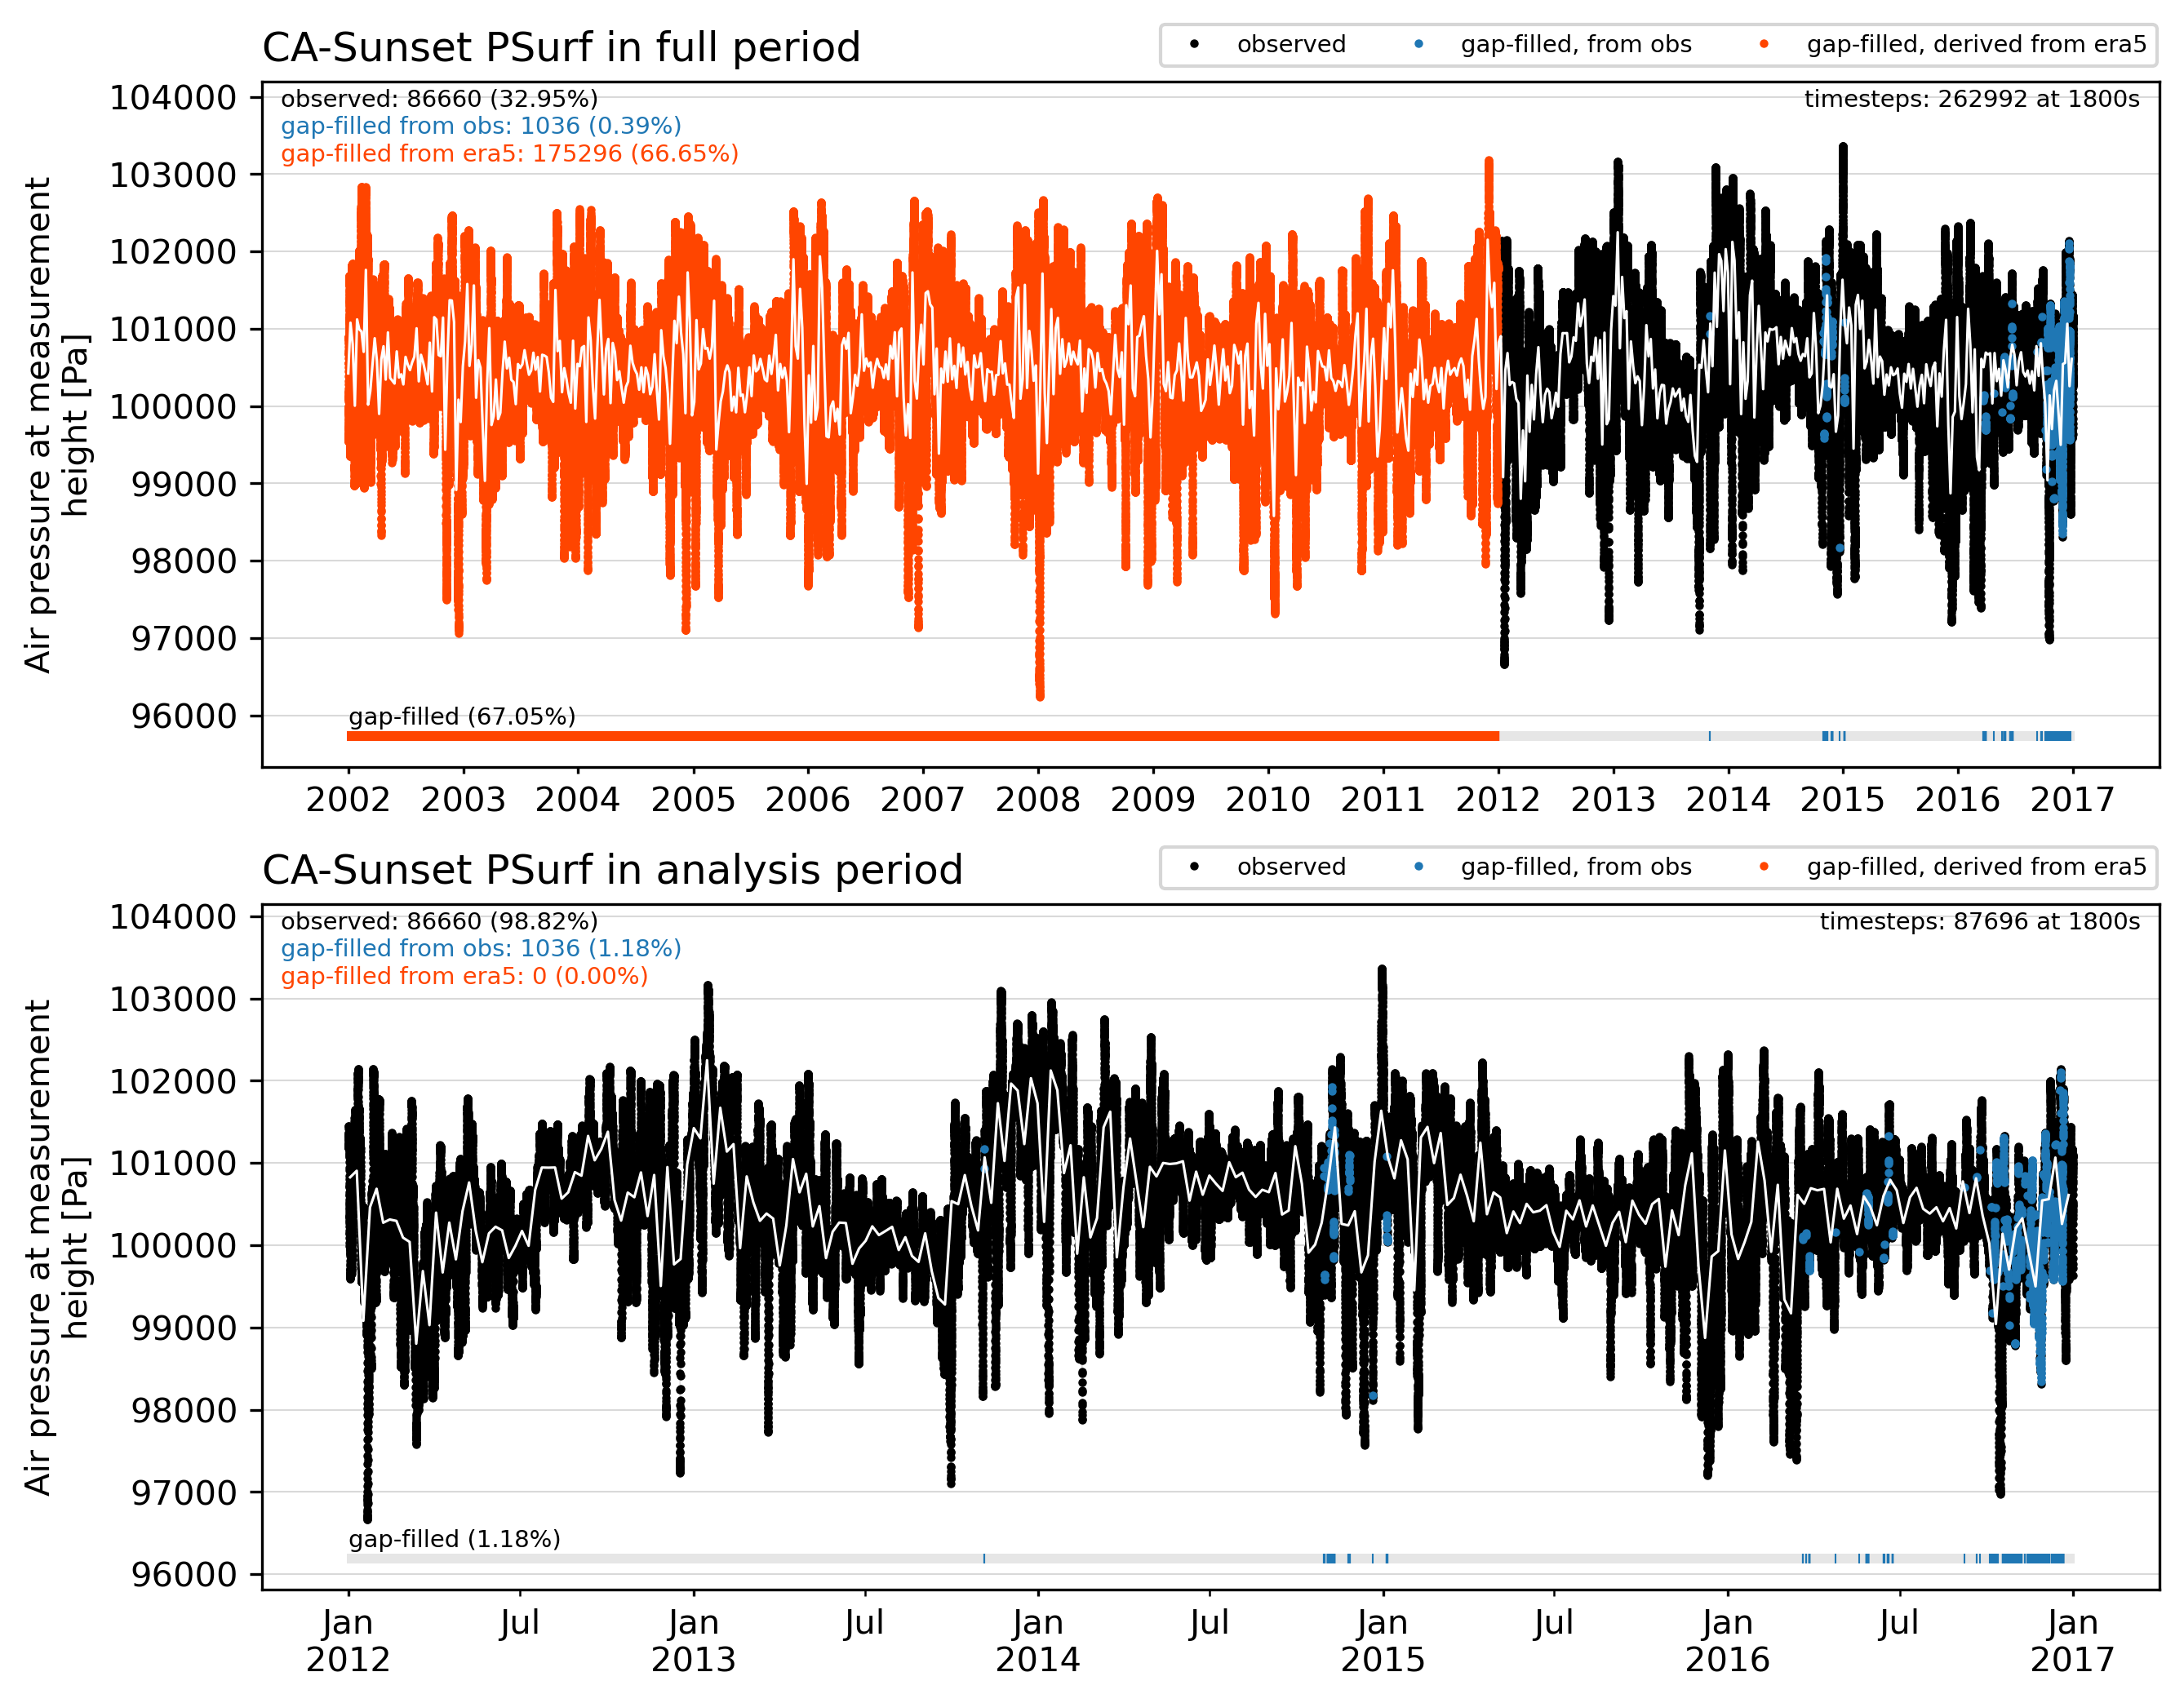
PSurf forcing
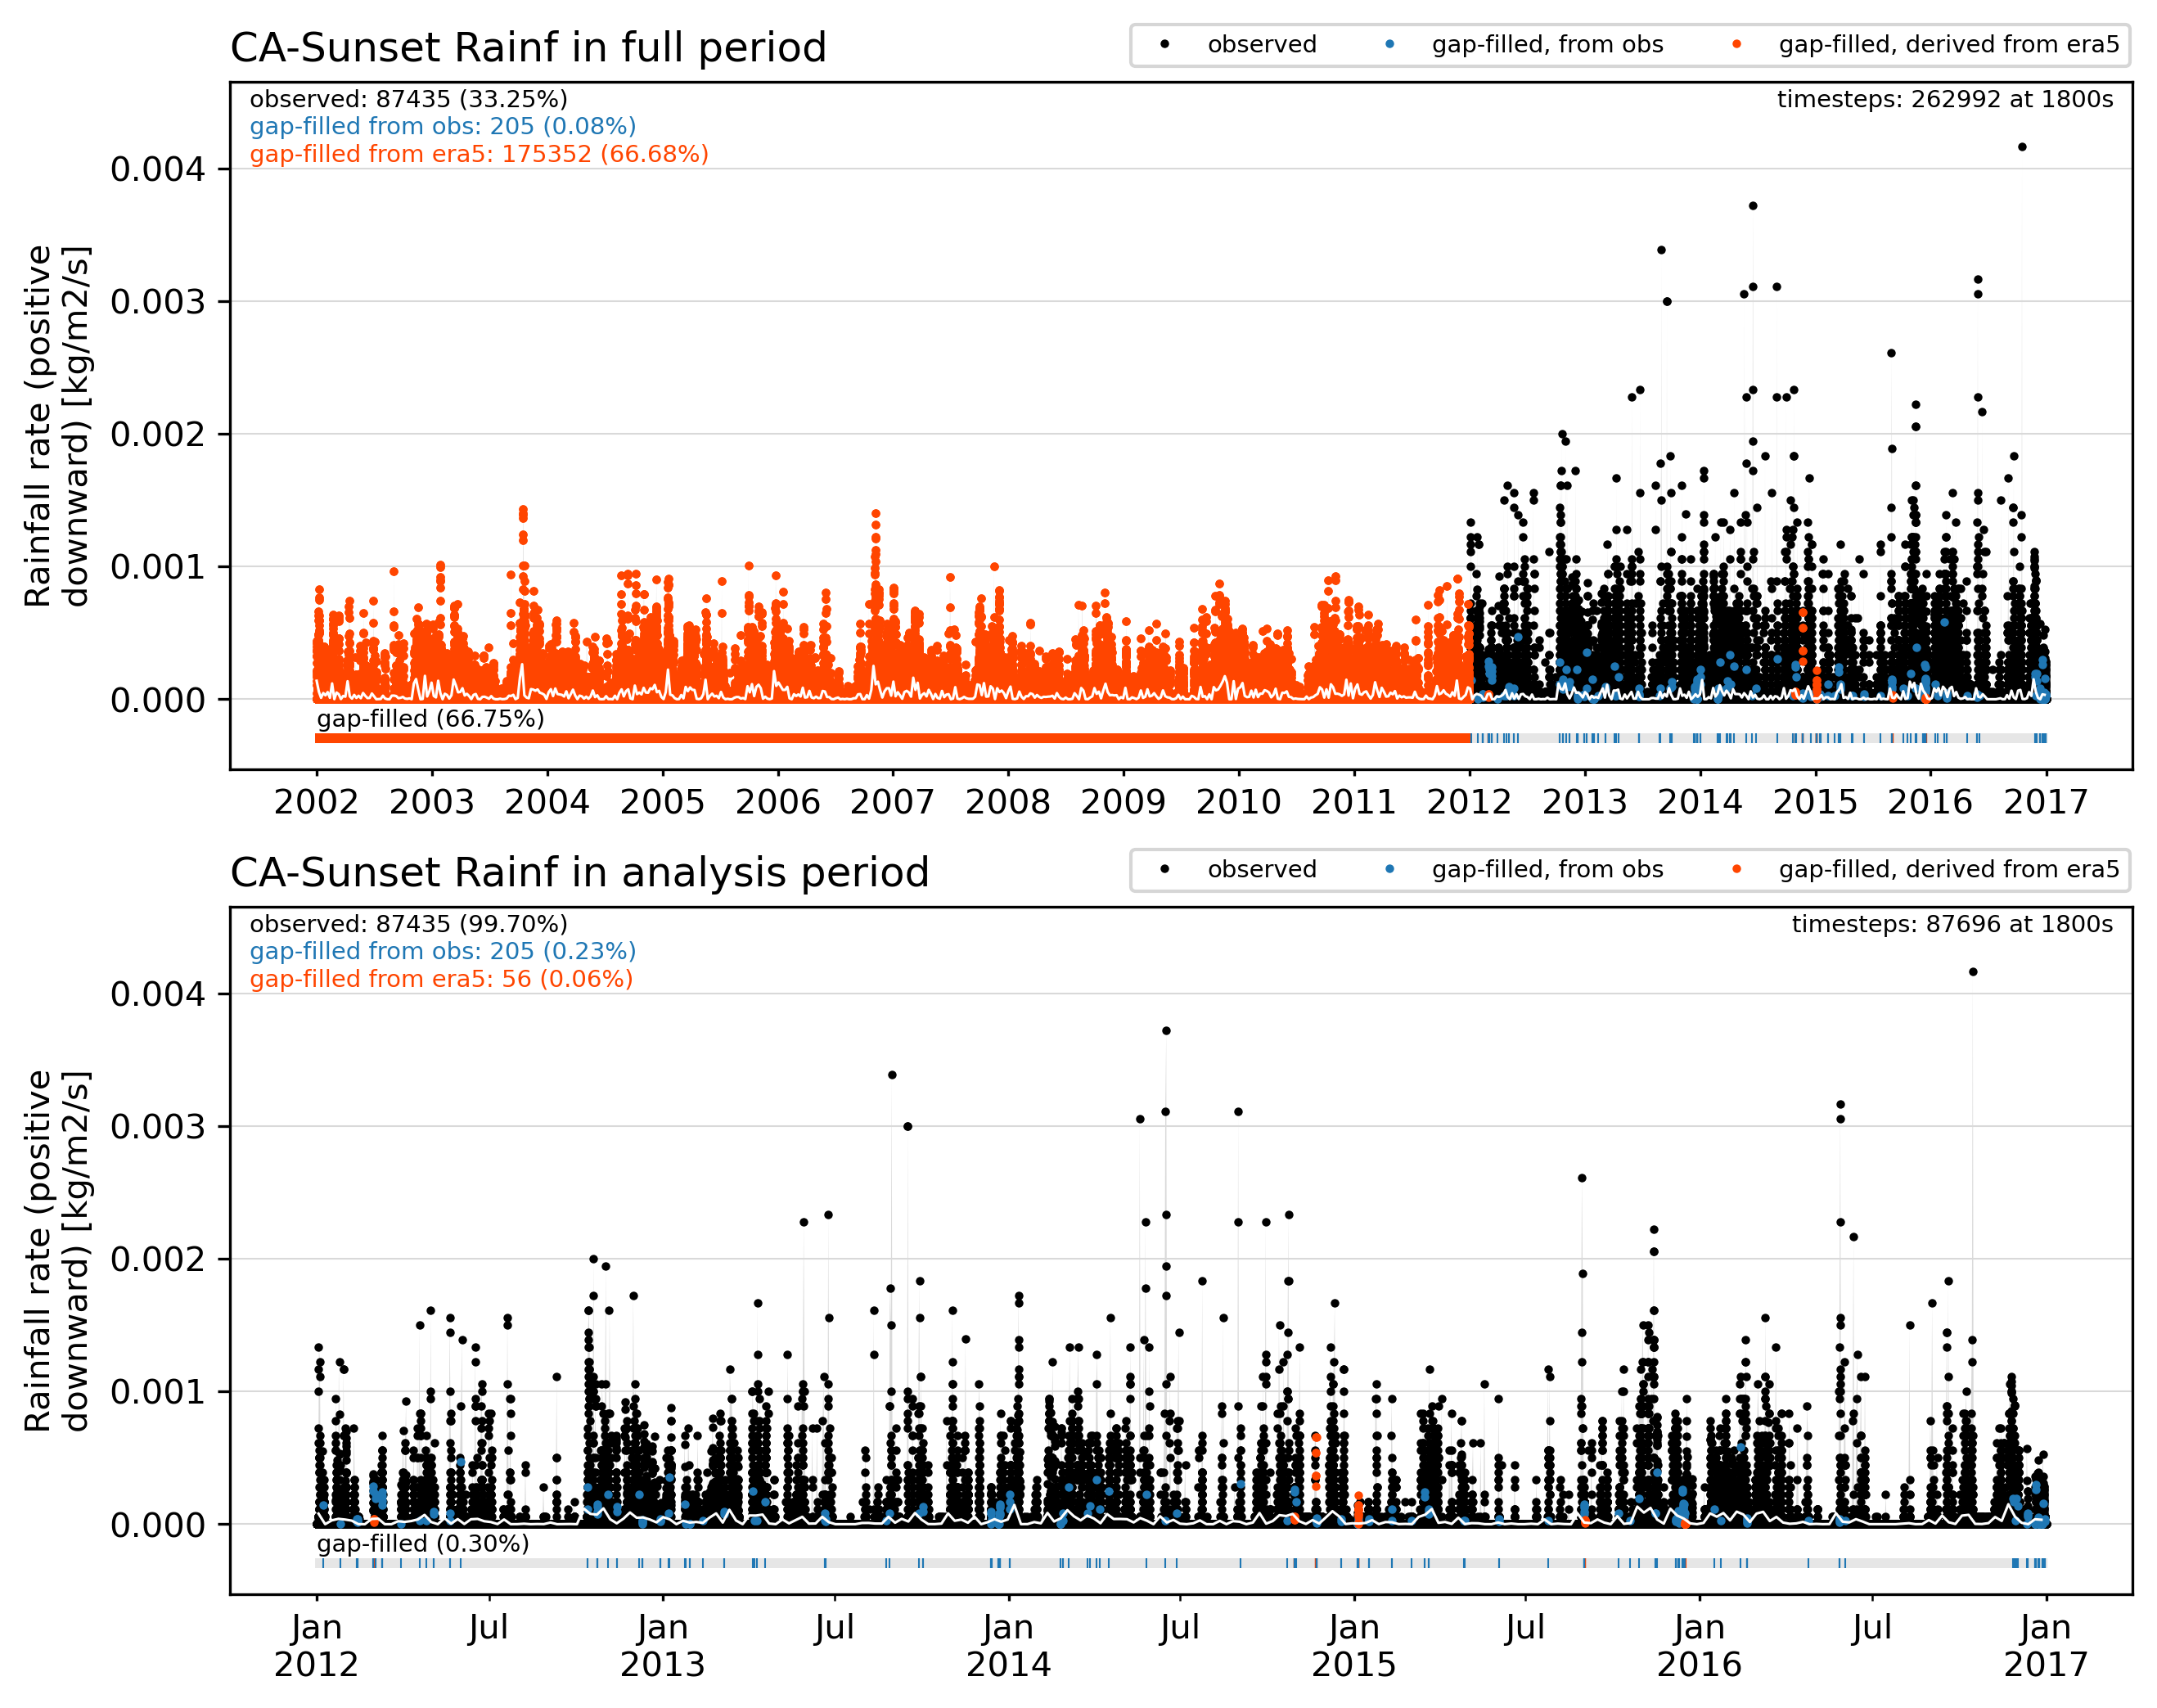
Rainf forcing
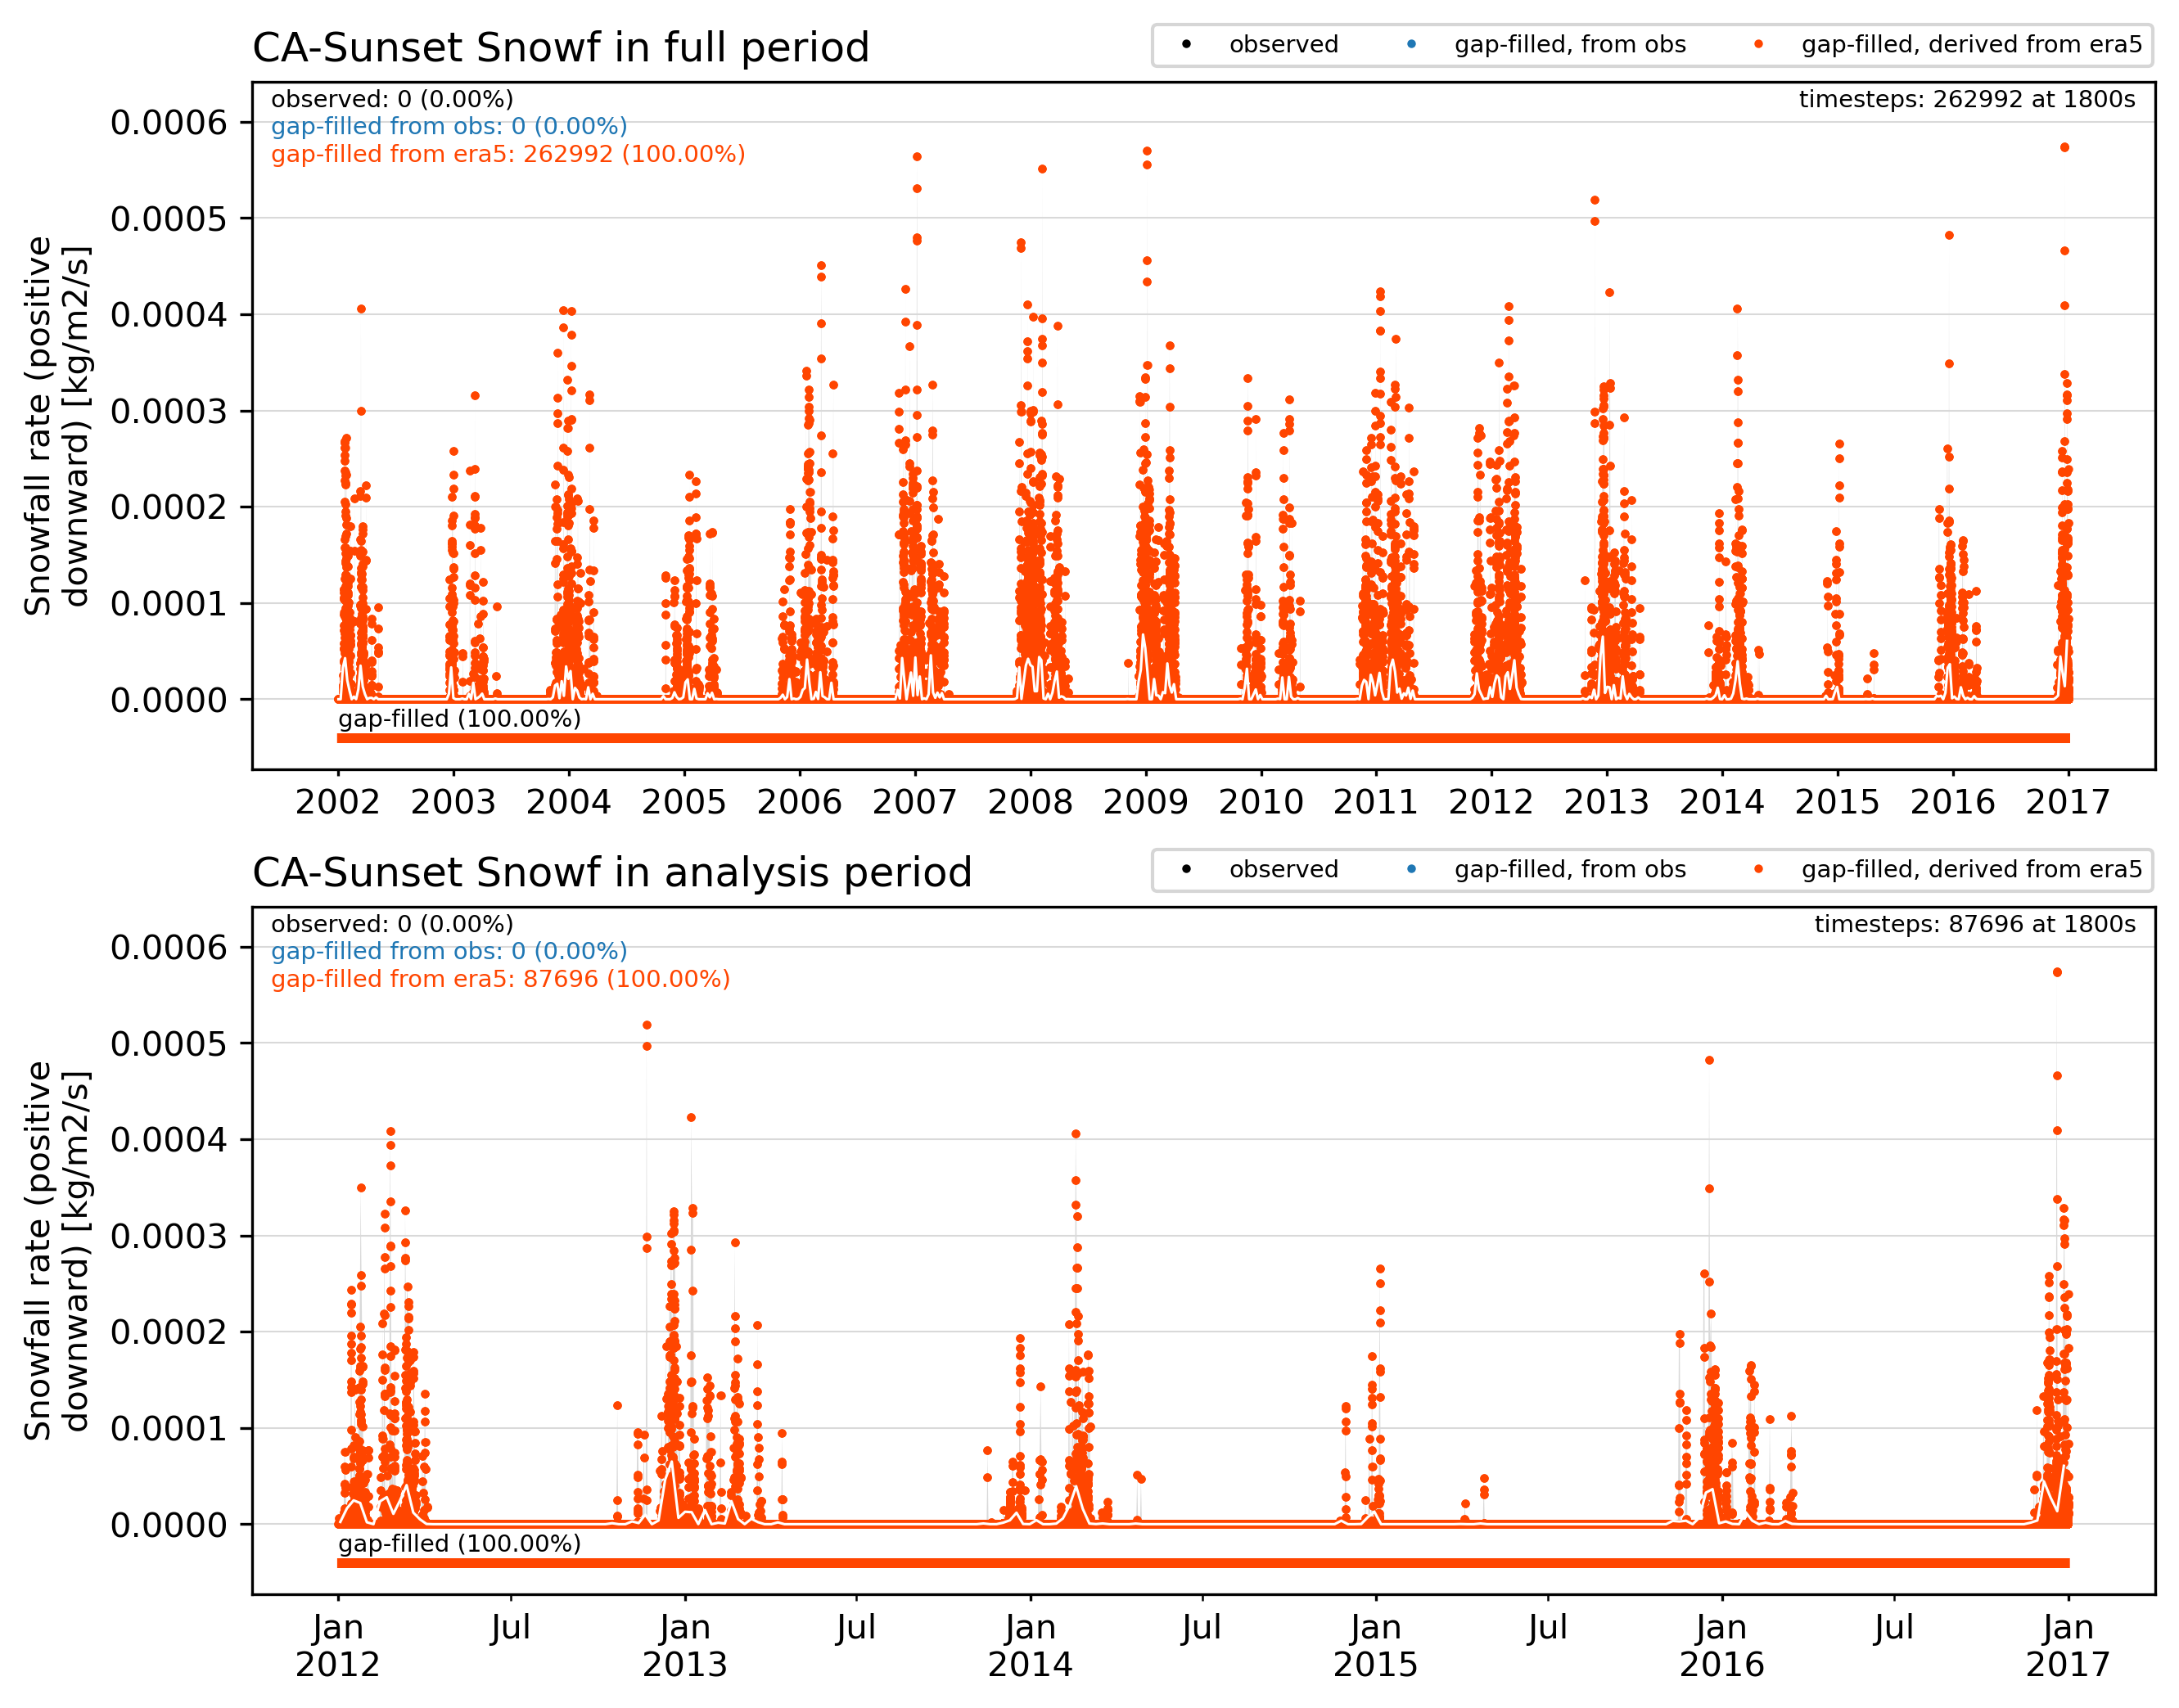
Snowf forcing
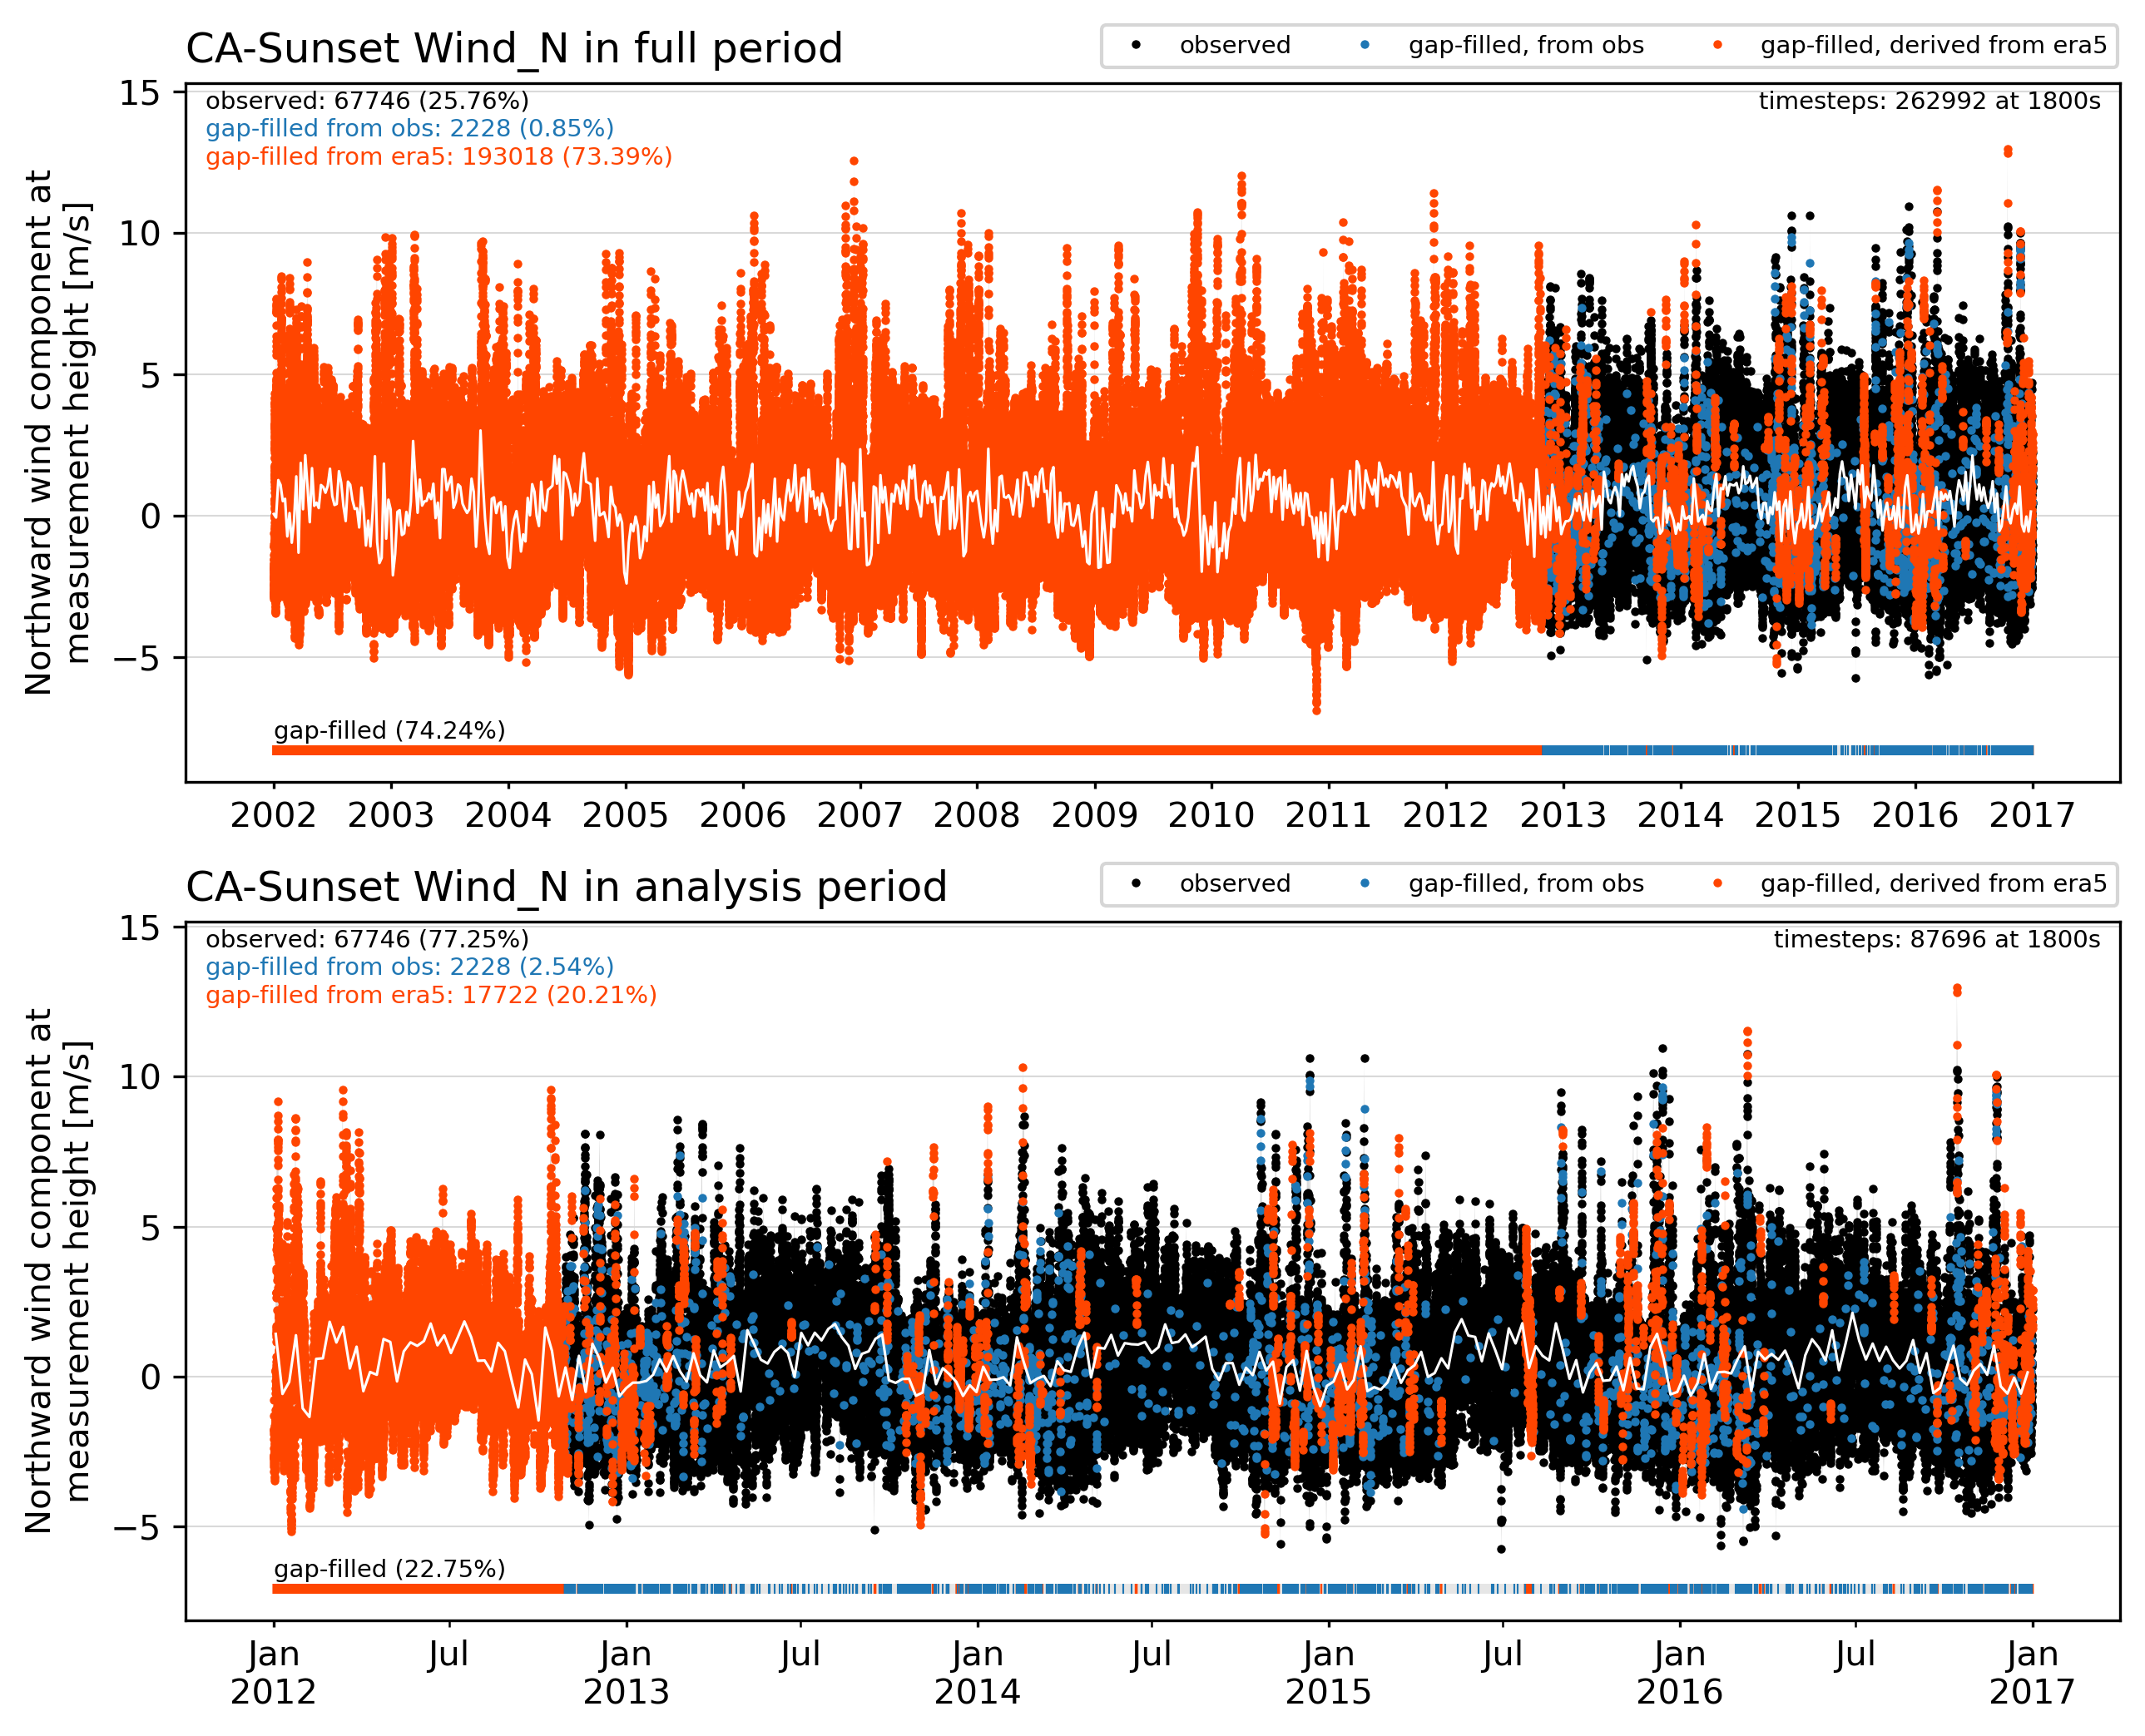
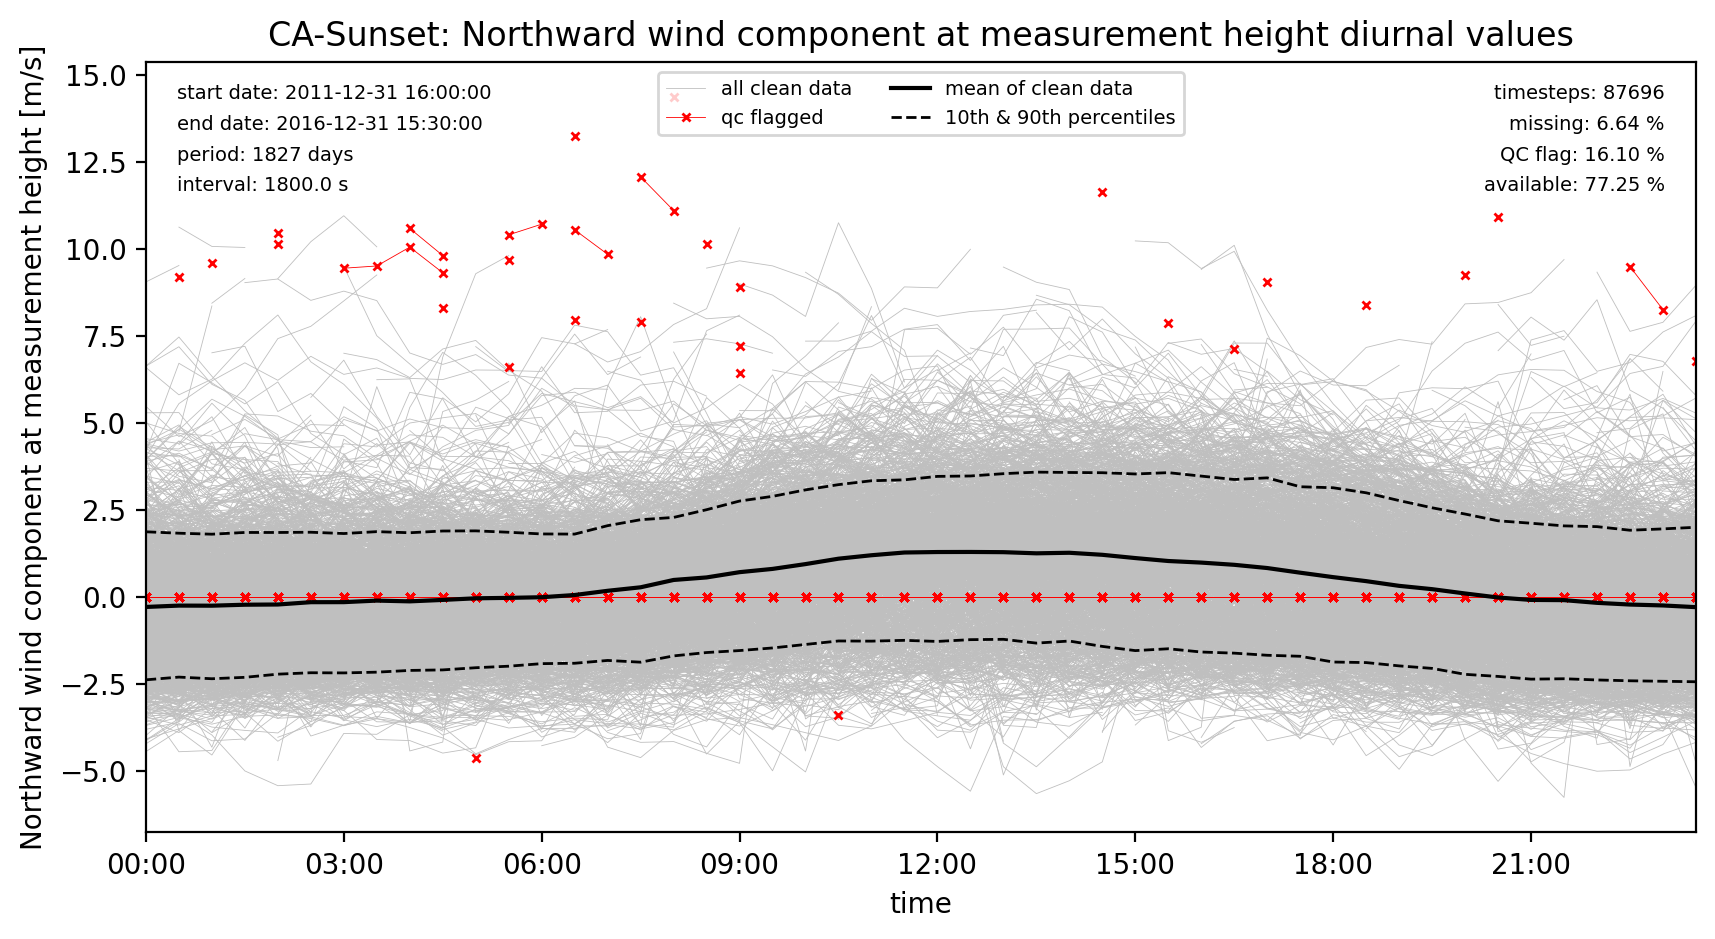
Wind_N forcing
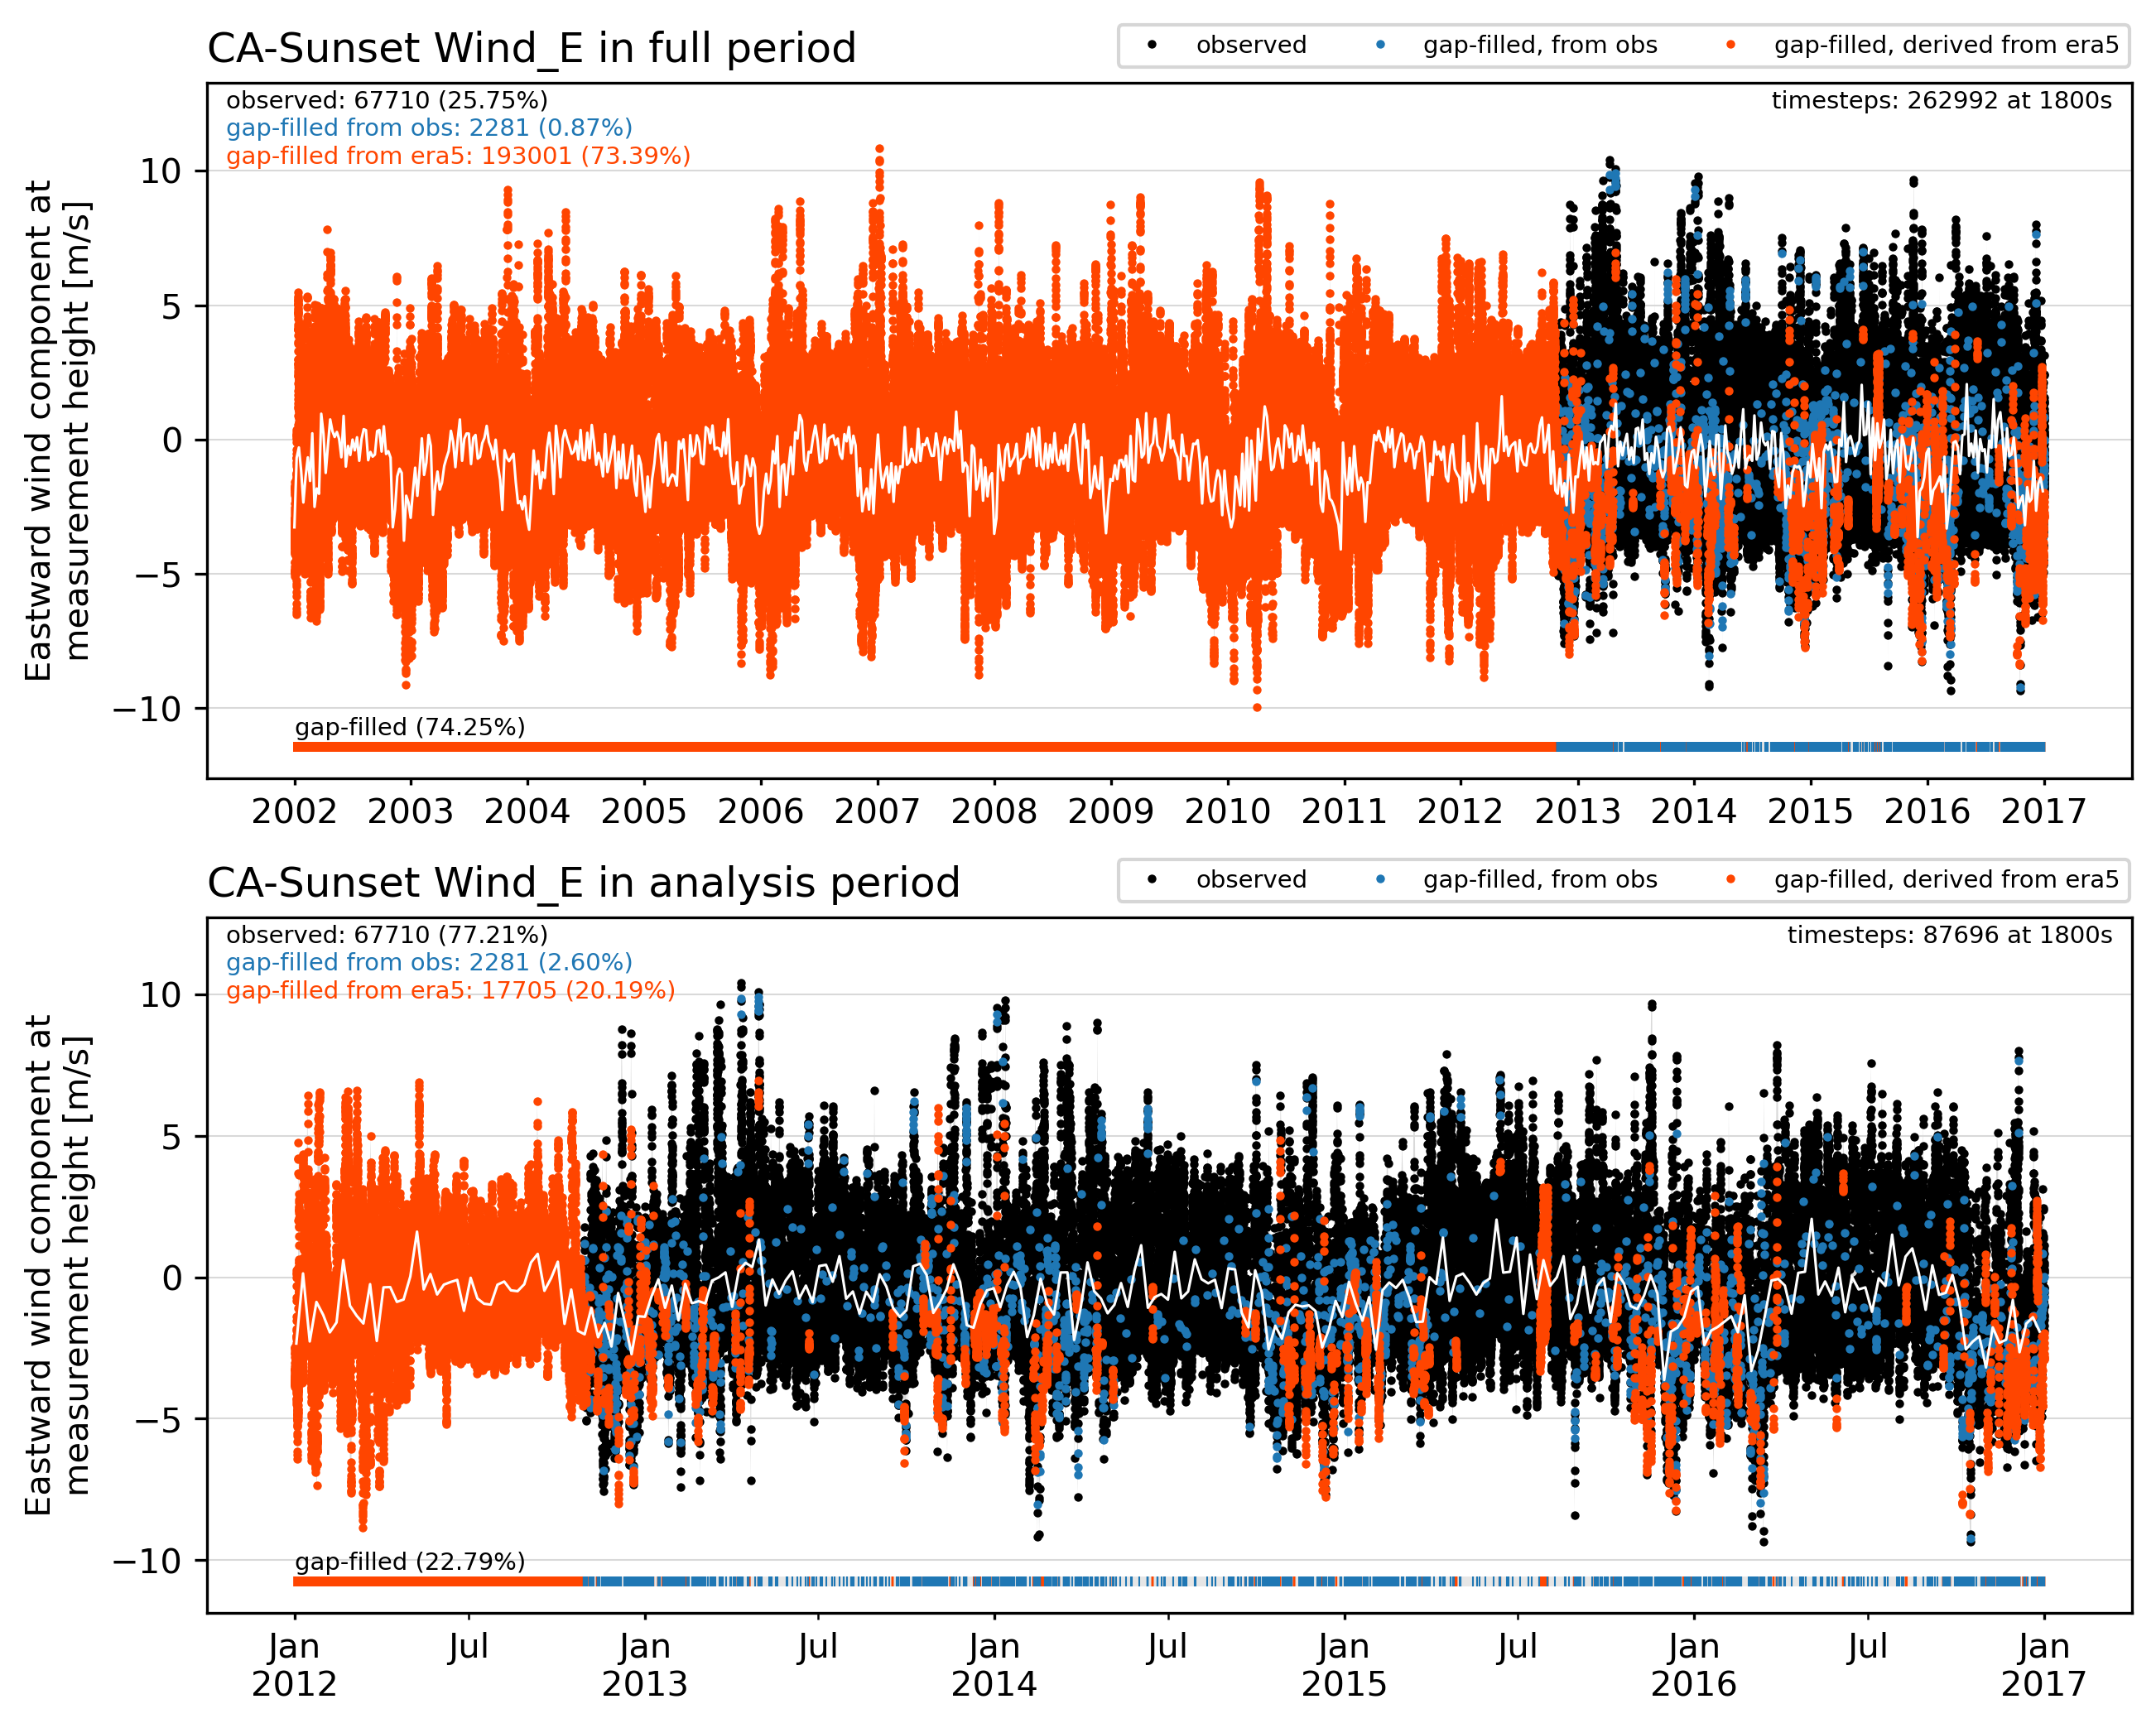
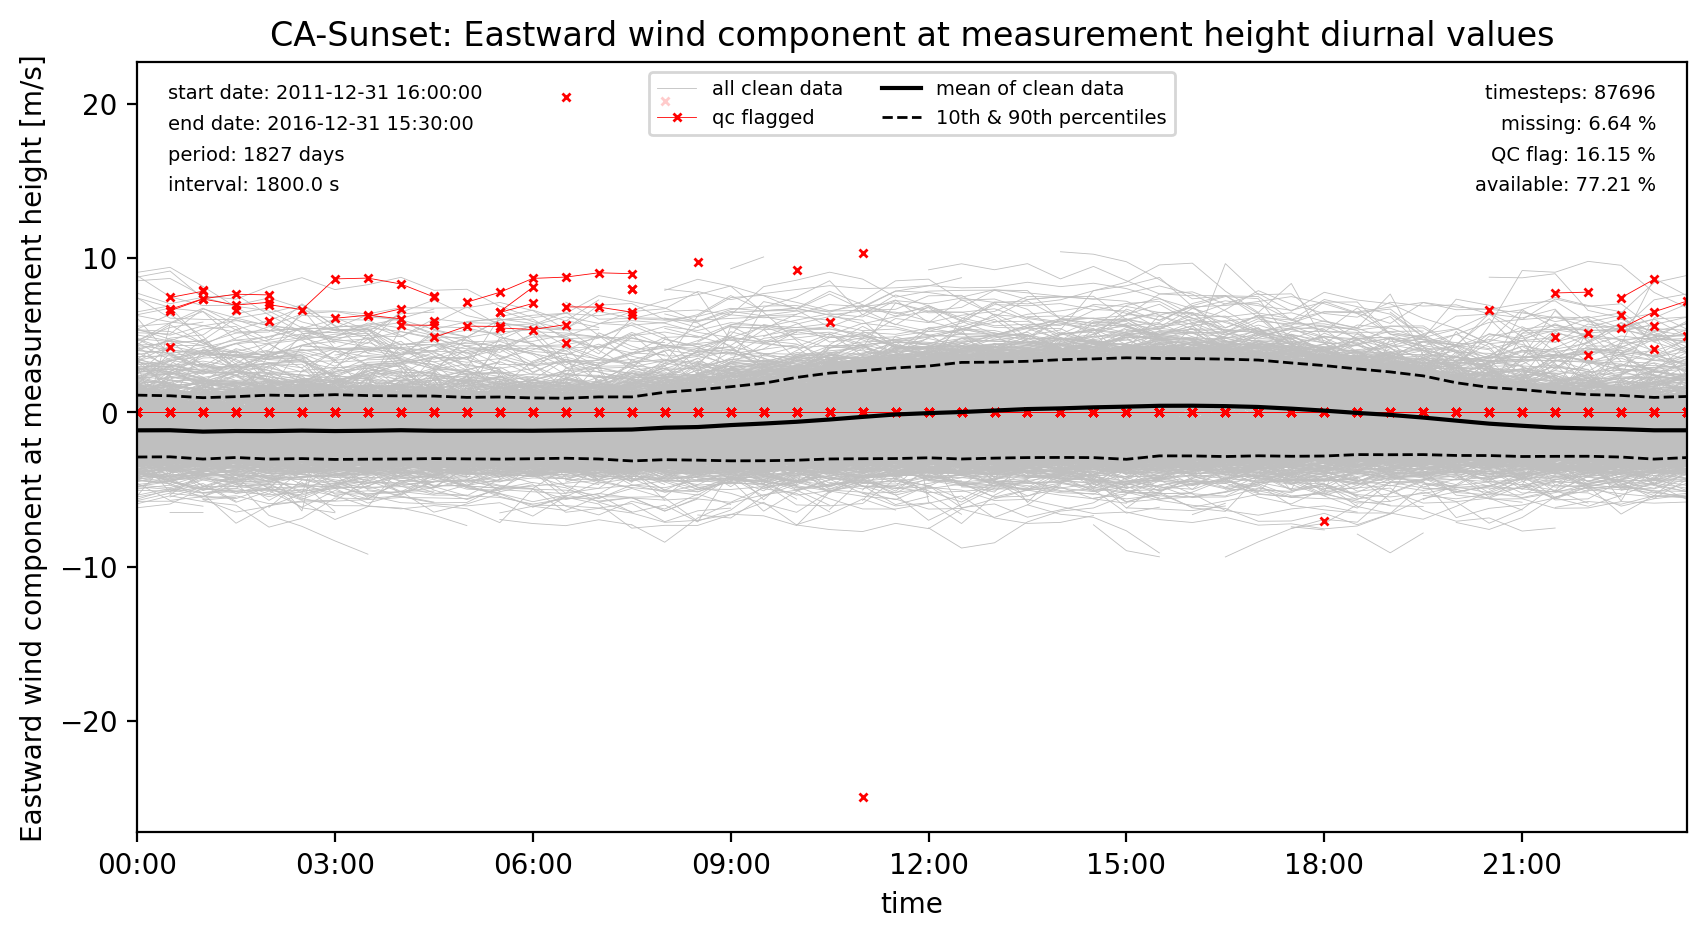
Wind_E forcing
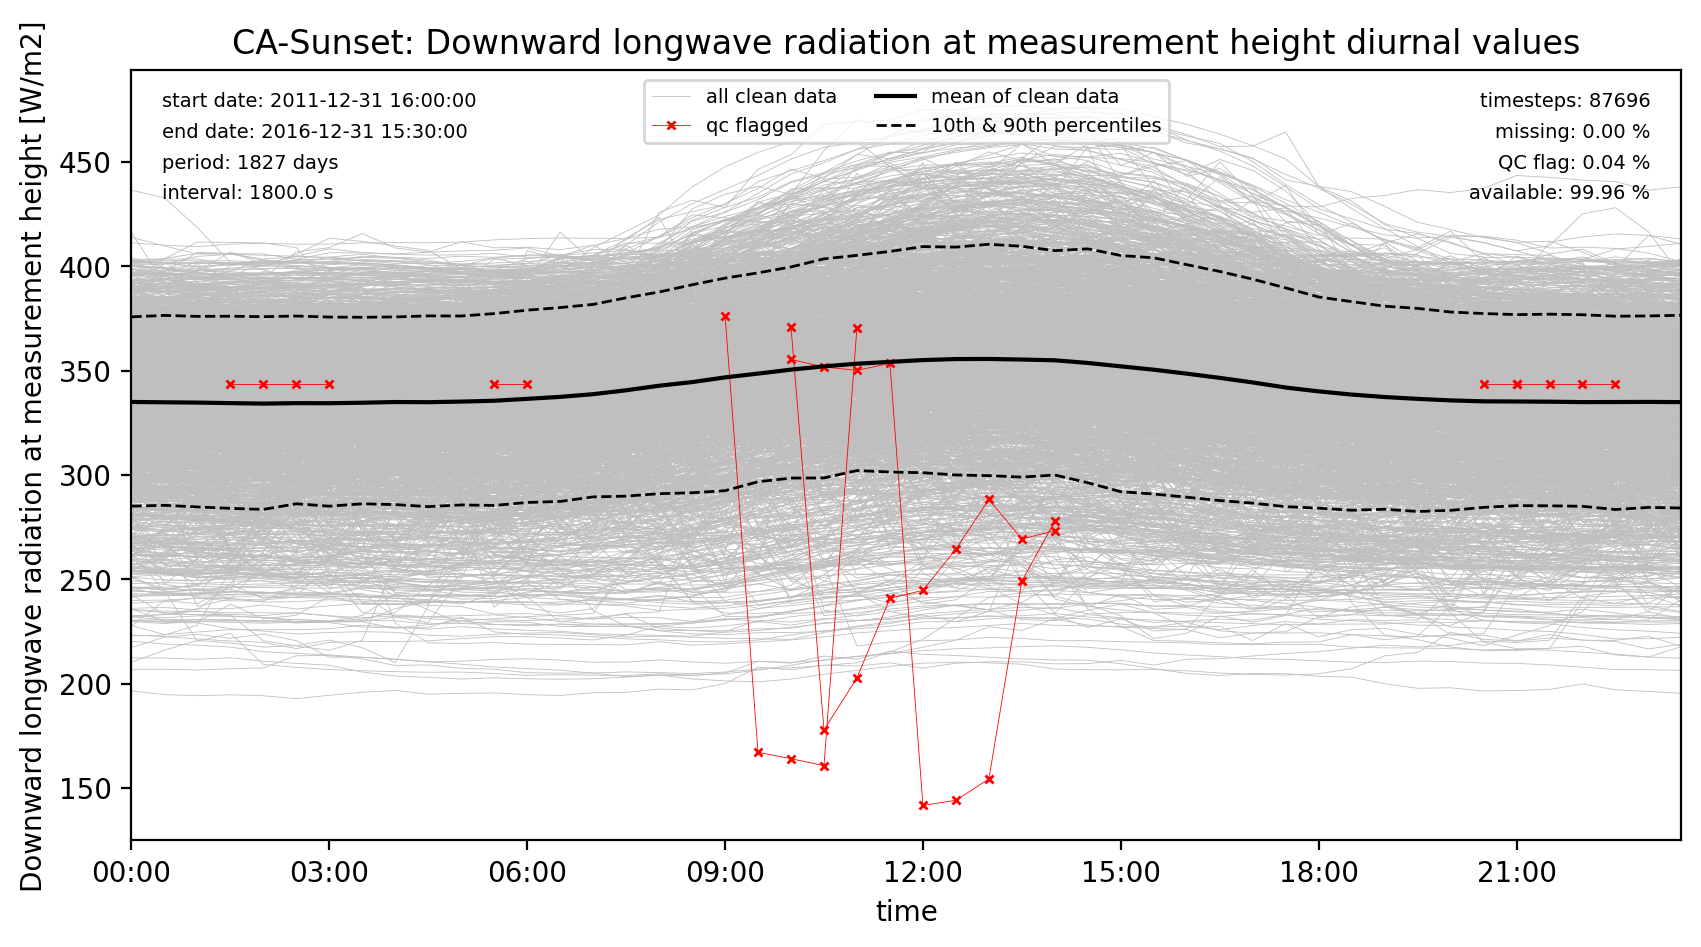
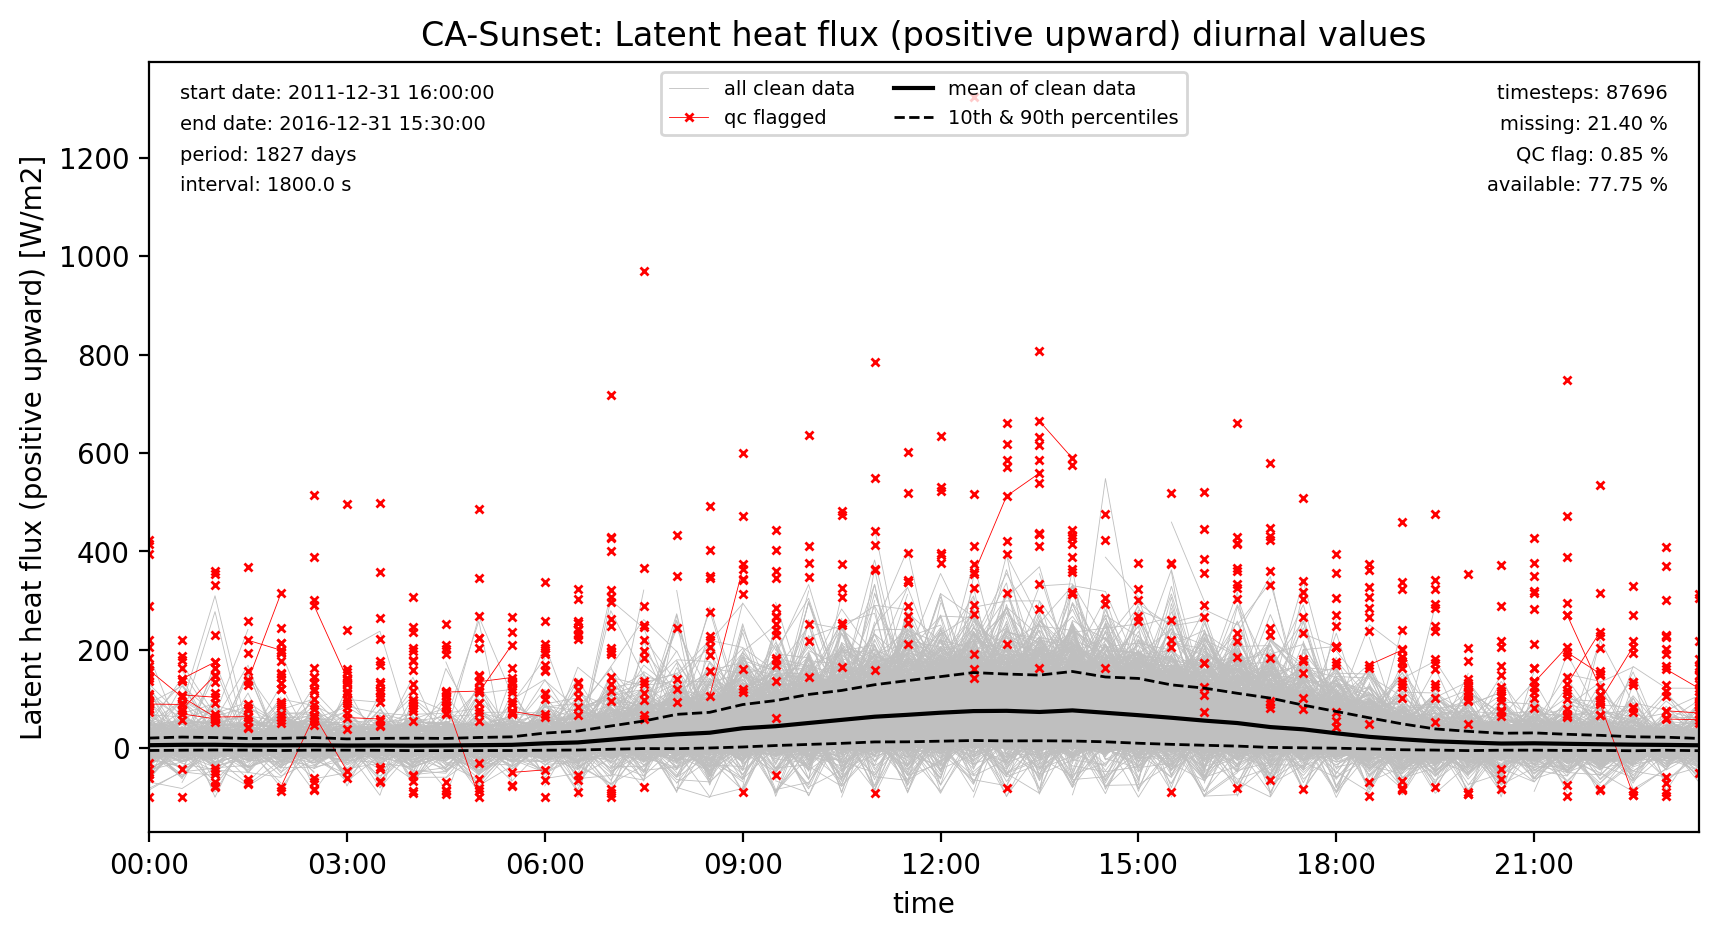
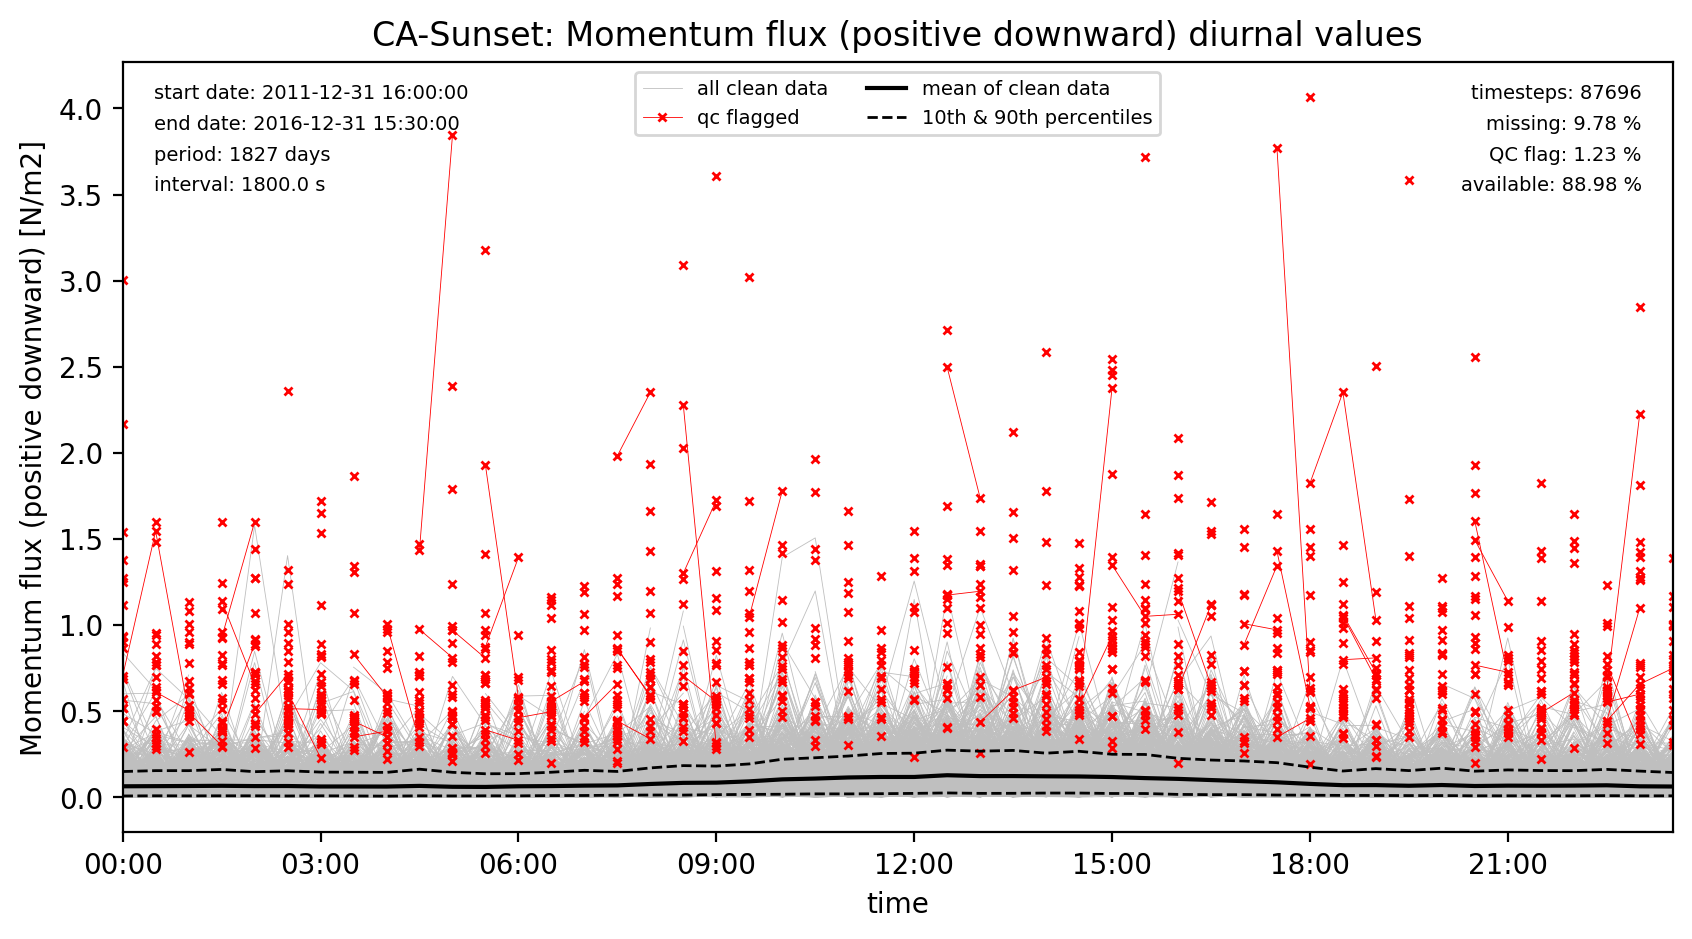
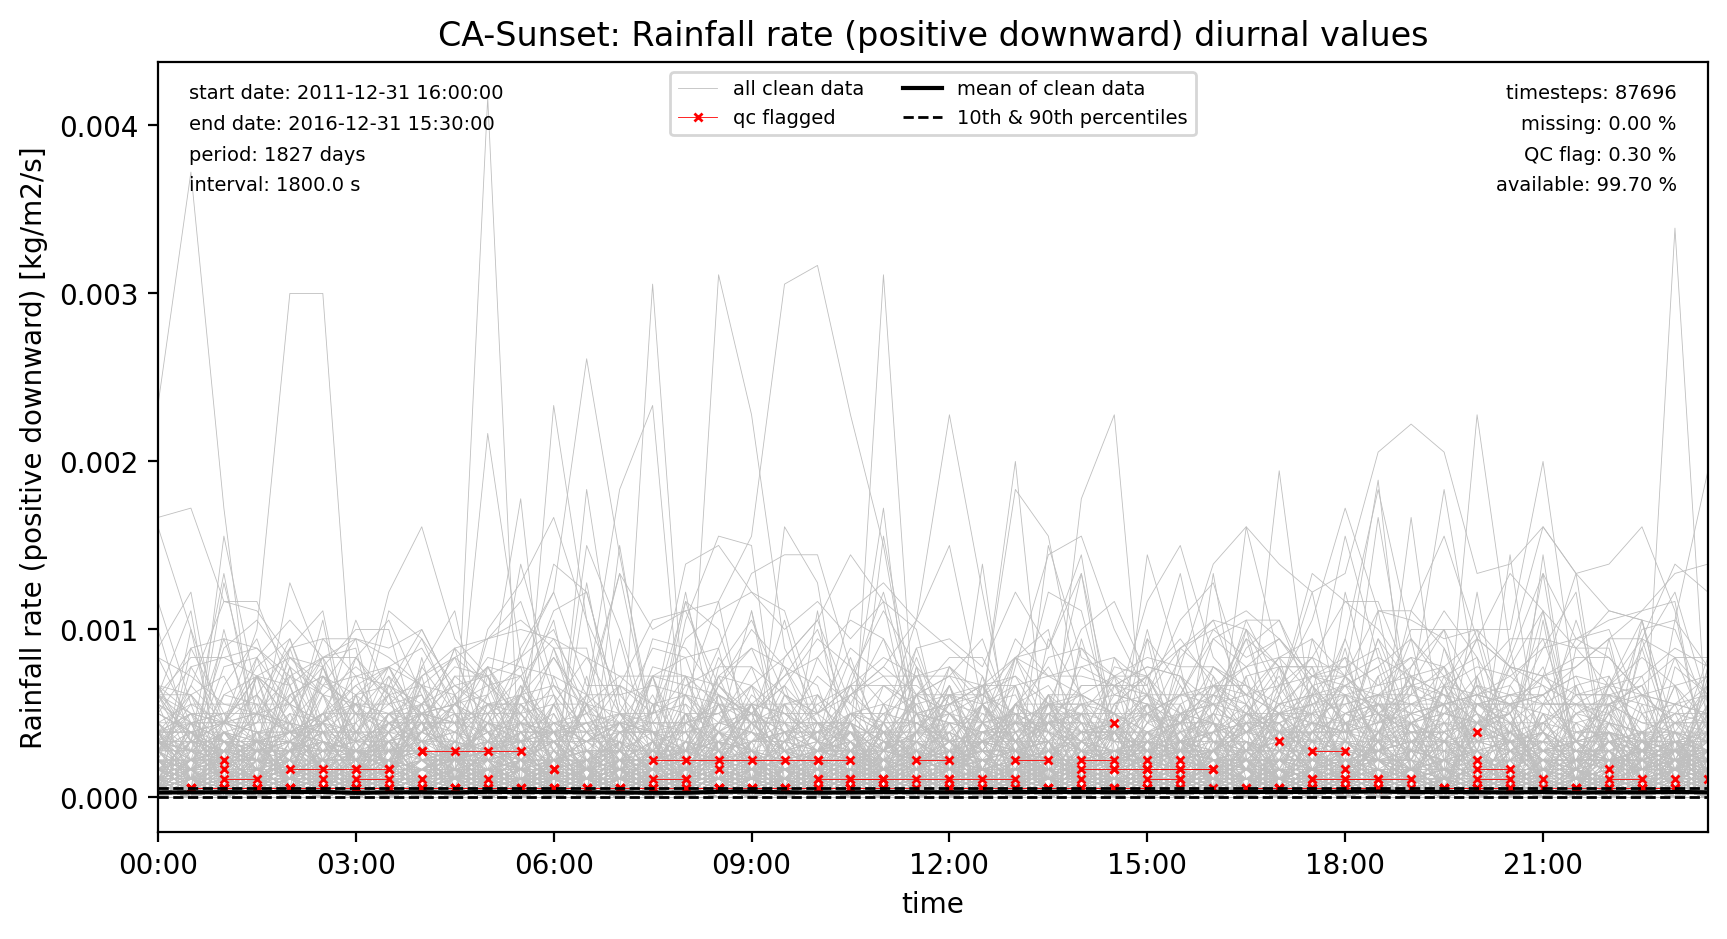
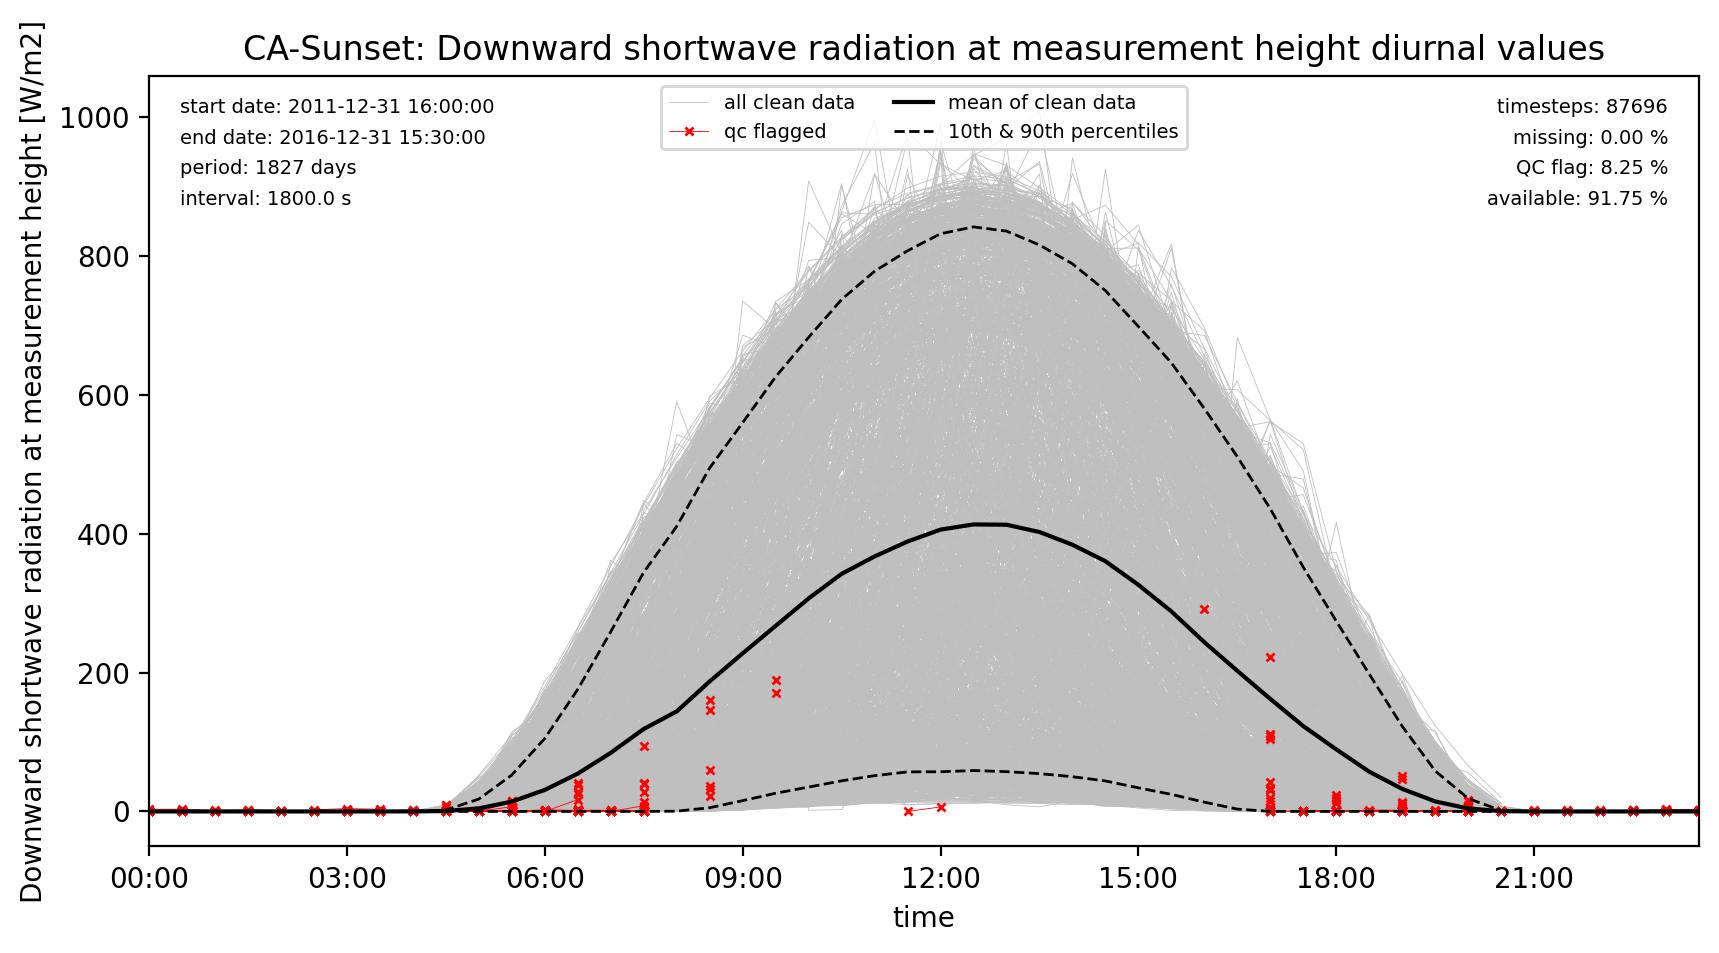
Quality control (qc) and gap filling procedure
QC process on observations
- Out-of-range: removal of unphysical values (e.g. negative shortwave radiation) using the ALMA expected range protocol.
- Night: nocturnal shortwave radiation set to zero, excluding civil twilight (when the sun is 6° below the horizon).
- Constant: four or more timesteps with the same value (excluding zero values for shortwave radiation, rainfall and snowfall) are removed as suspicious.
- Outlier: remove values outside ±4 standard deviations for each hour in a rolling 30-day window (to account for diurnal and seasonal variations). Repeat with a larger tolerance (± 5 standard deviations) until no outliers remain. The outlier test is not applied to precipitation.
- Visual: remaining suspect readings are removed manually via visual inspection.
Gap-filling process
- contemporaneous and nearby flux tower or weather observing sites (where available and provided by observing groups)
- small gaps (≤ 2 hours) are linearly interpolated from the adjoining observations
- larger gaps (and a 10-year spin-up period) are filled with bias corrected ERA5 data (see below)
- snowfall from ERA5, with water equivalent removed from rainfall to retain mass balance
LWdown diurnal qc
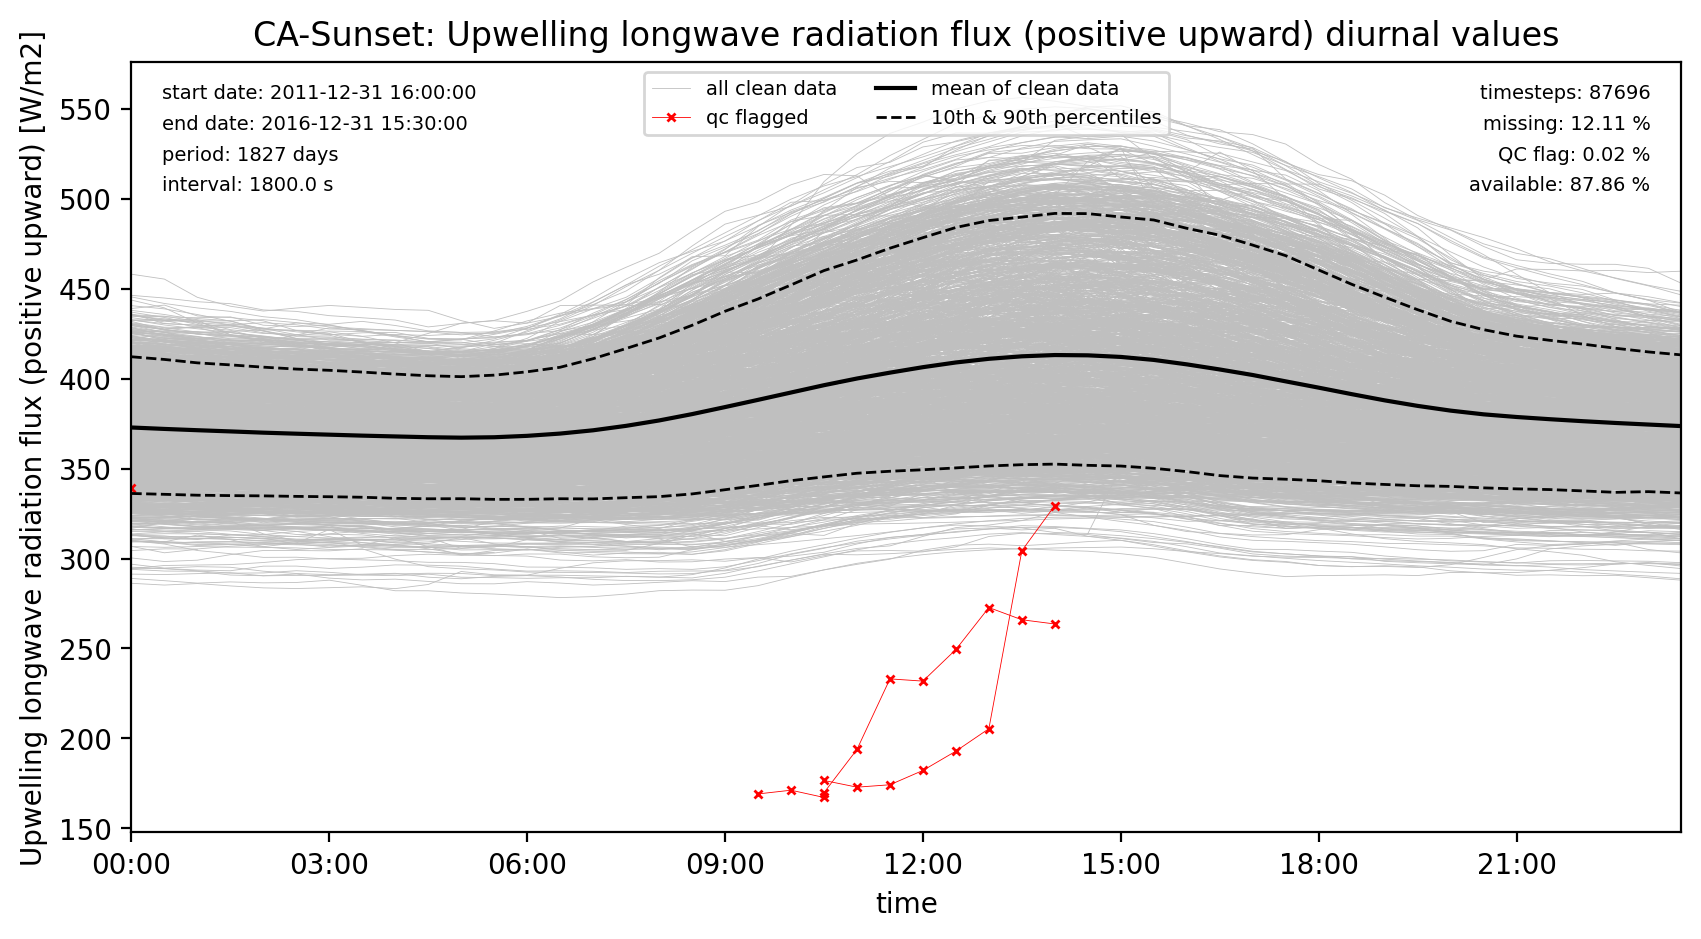
LWup diurnal qc
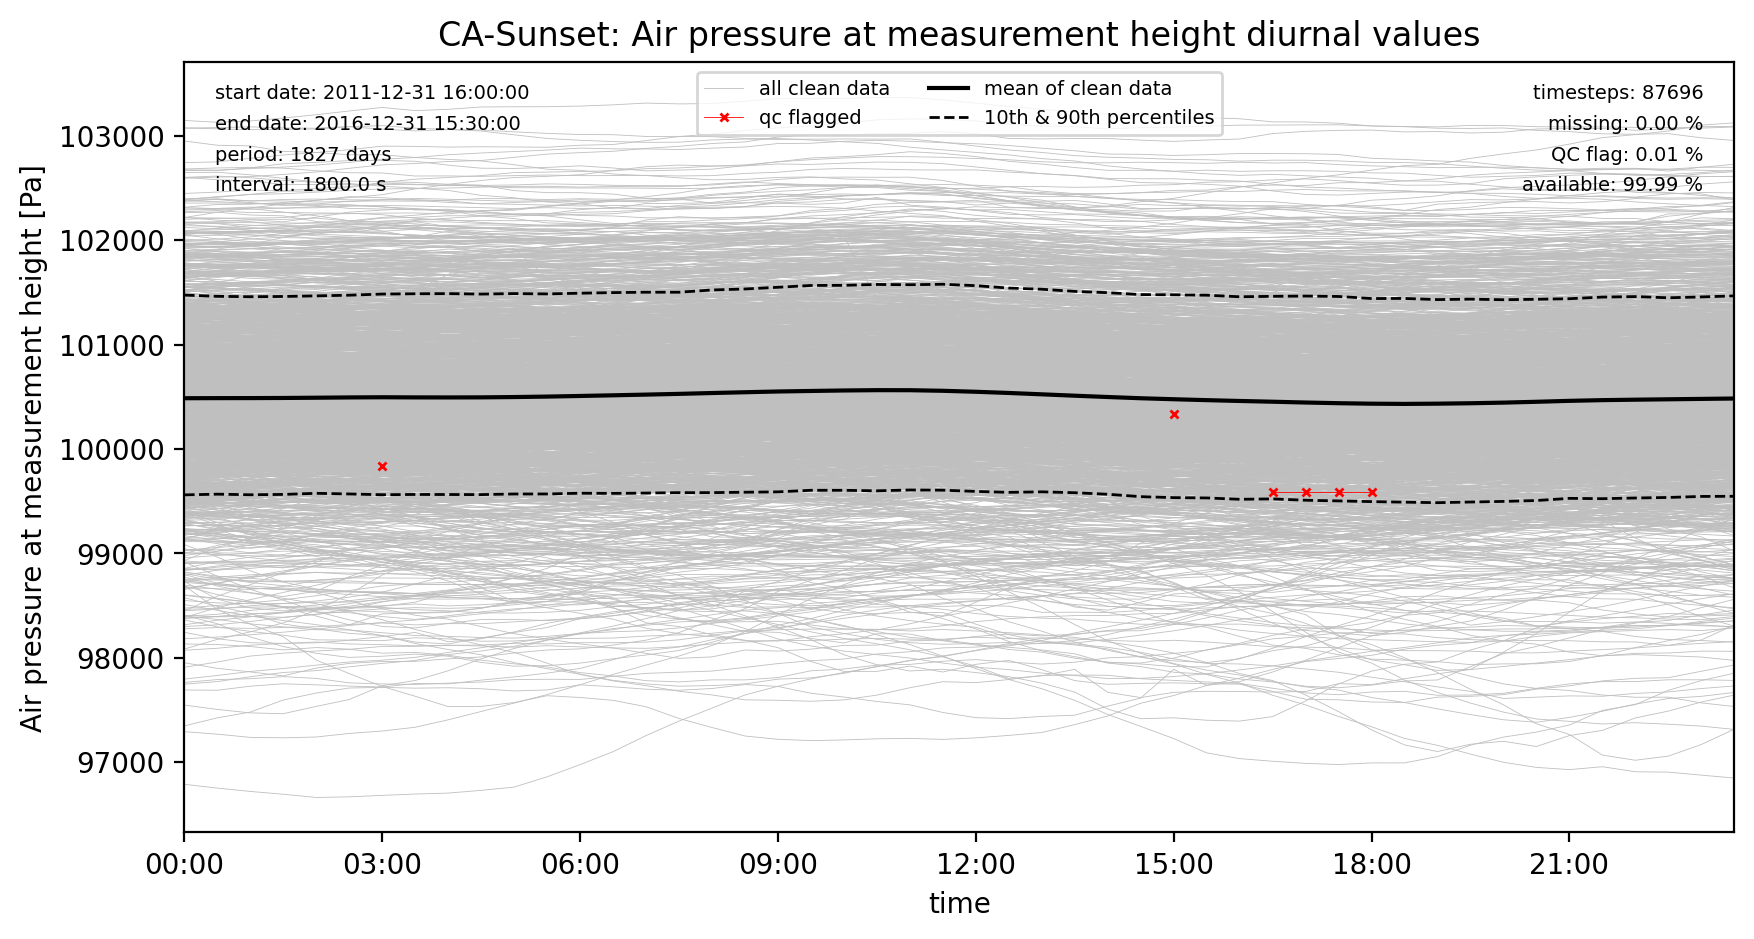
PSurf diurnal qc
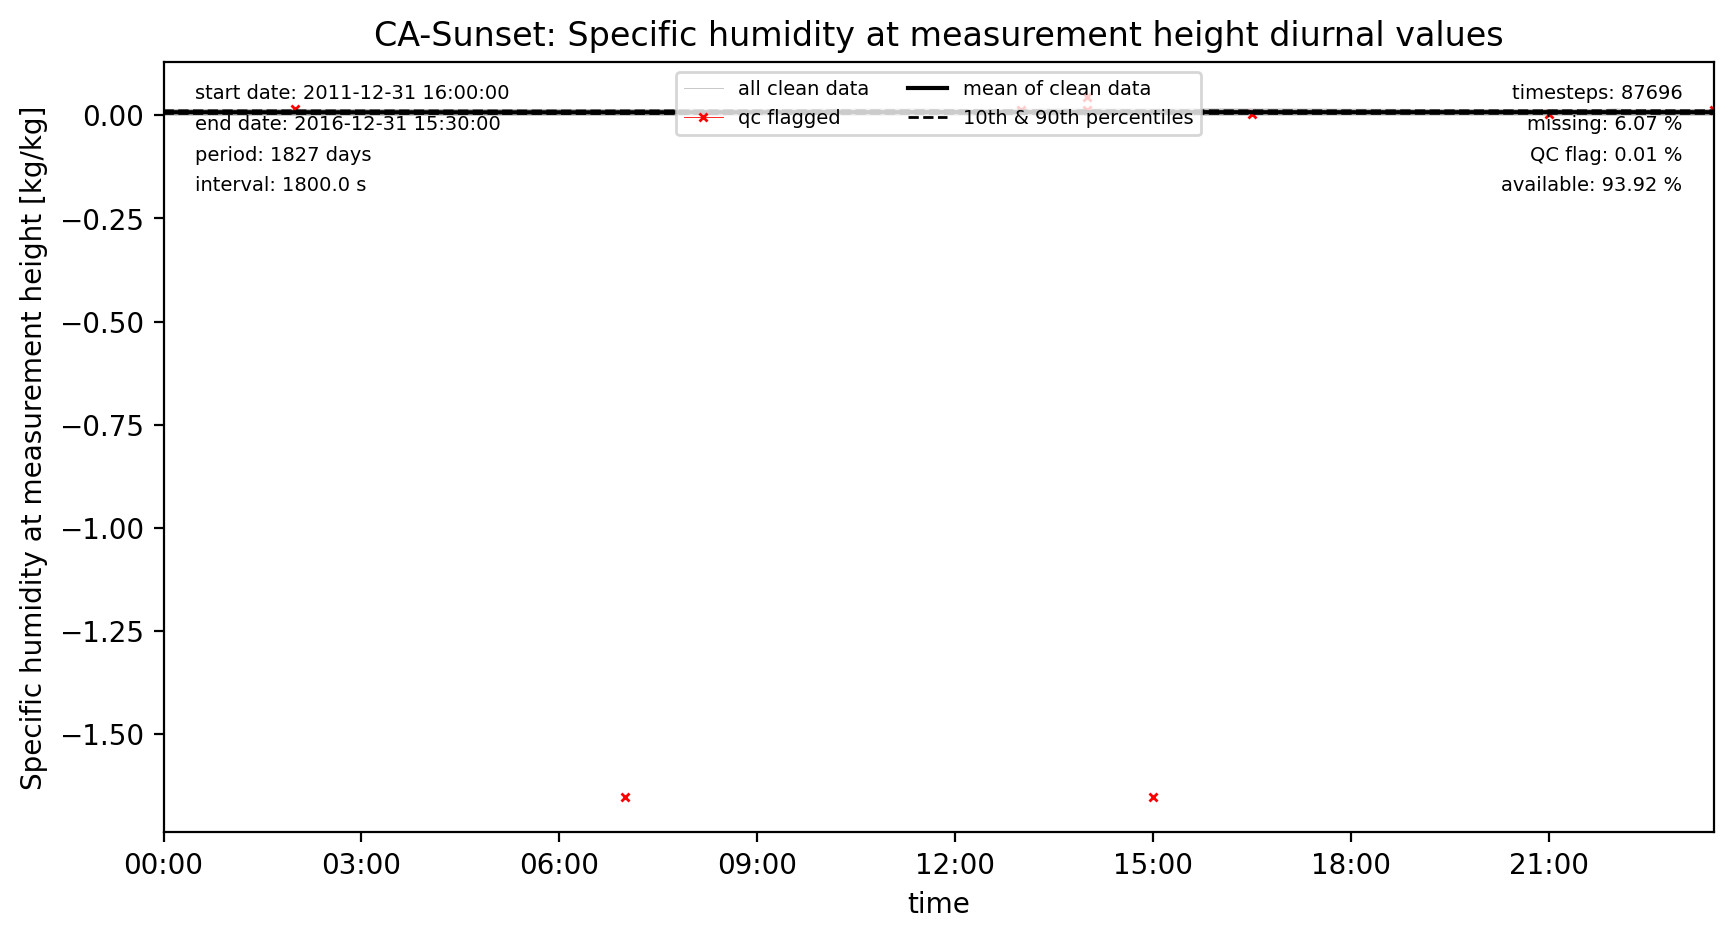
Qair diurnal qc
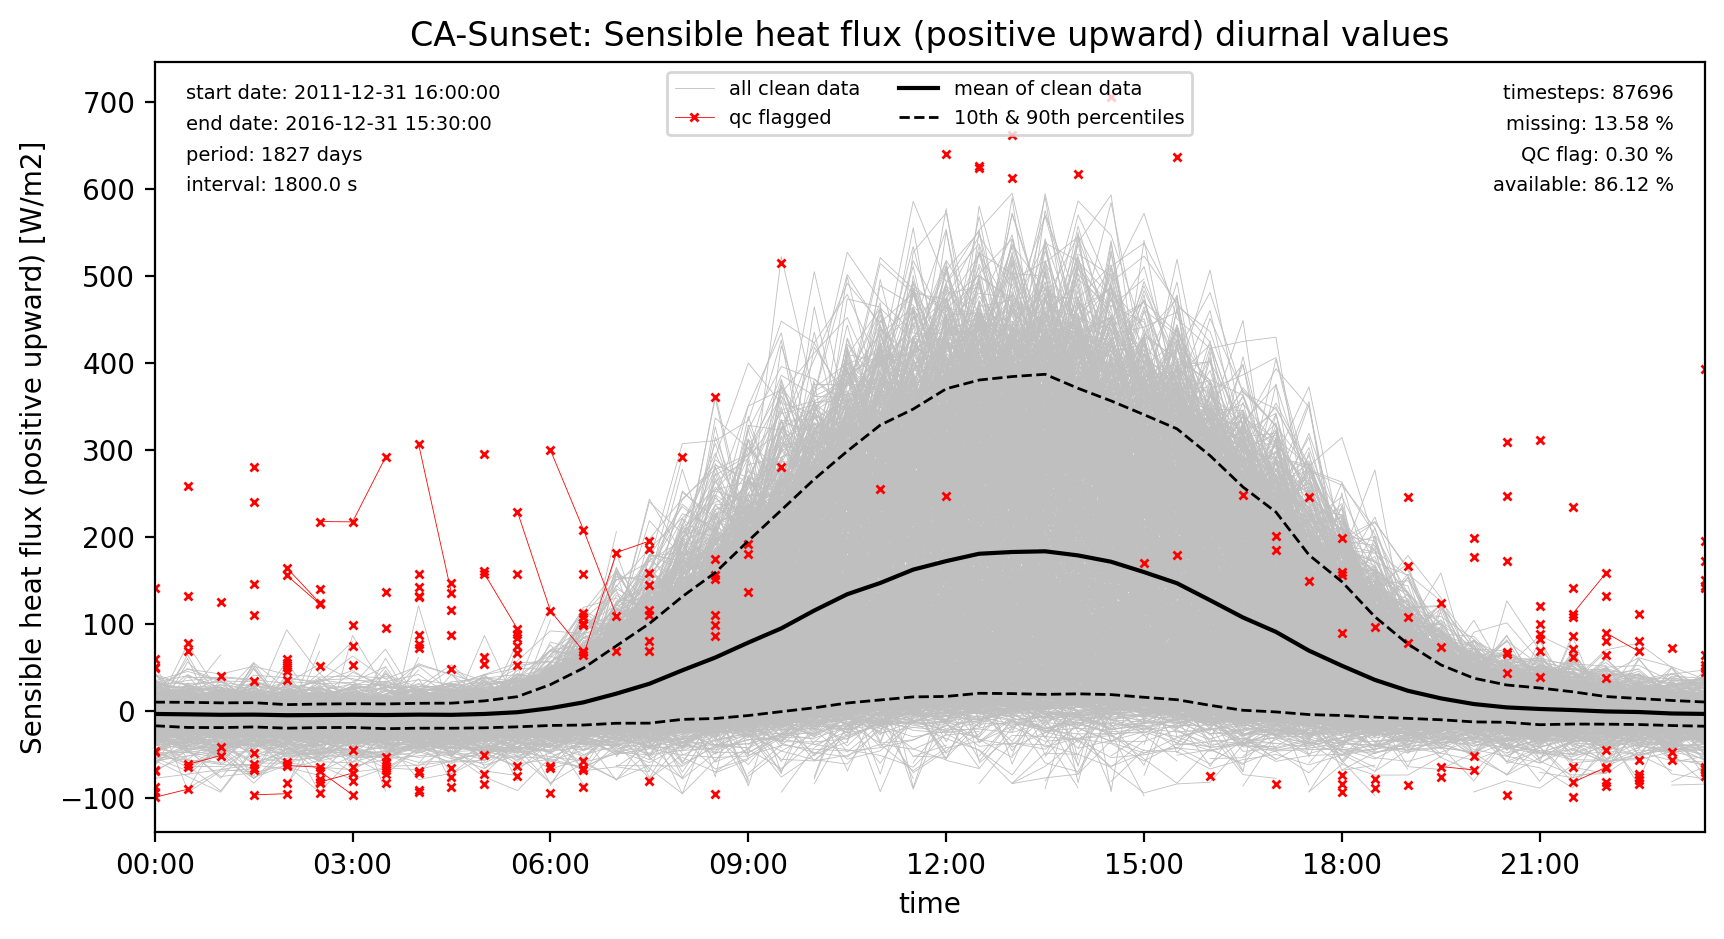
Qh diurnal qc
Qle diurnal qc
Qtau diurnal qc
Rainf diurnal qc
SWdown diurnal qc
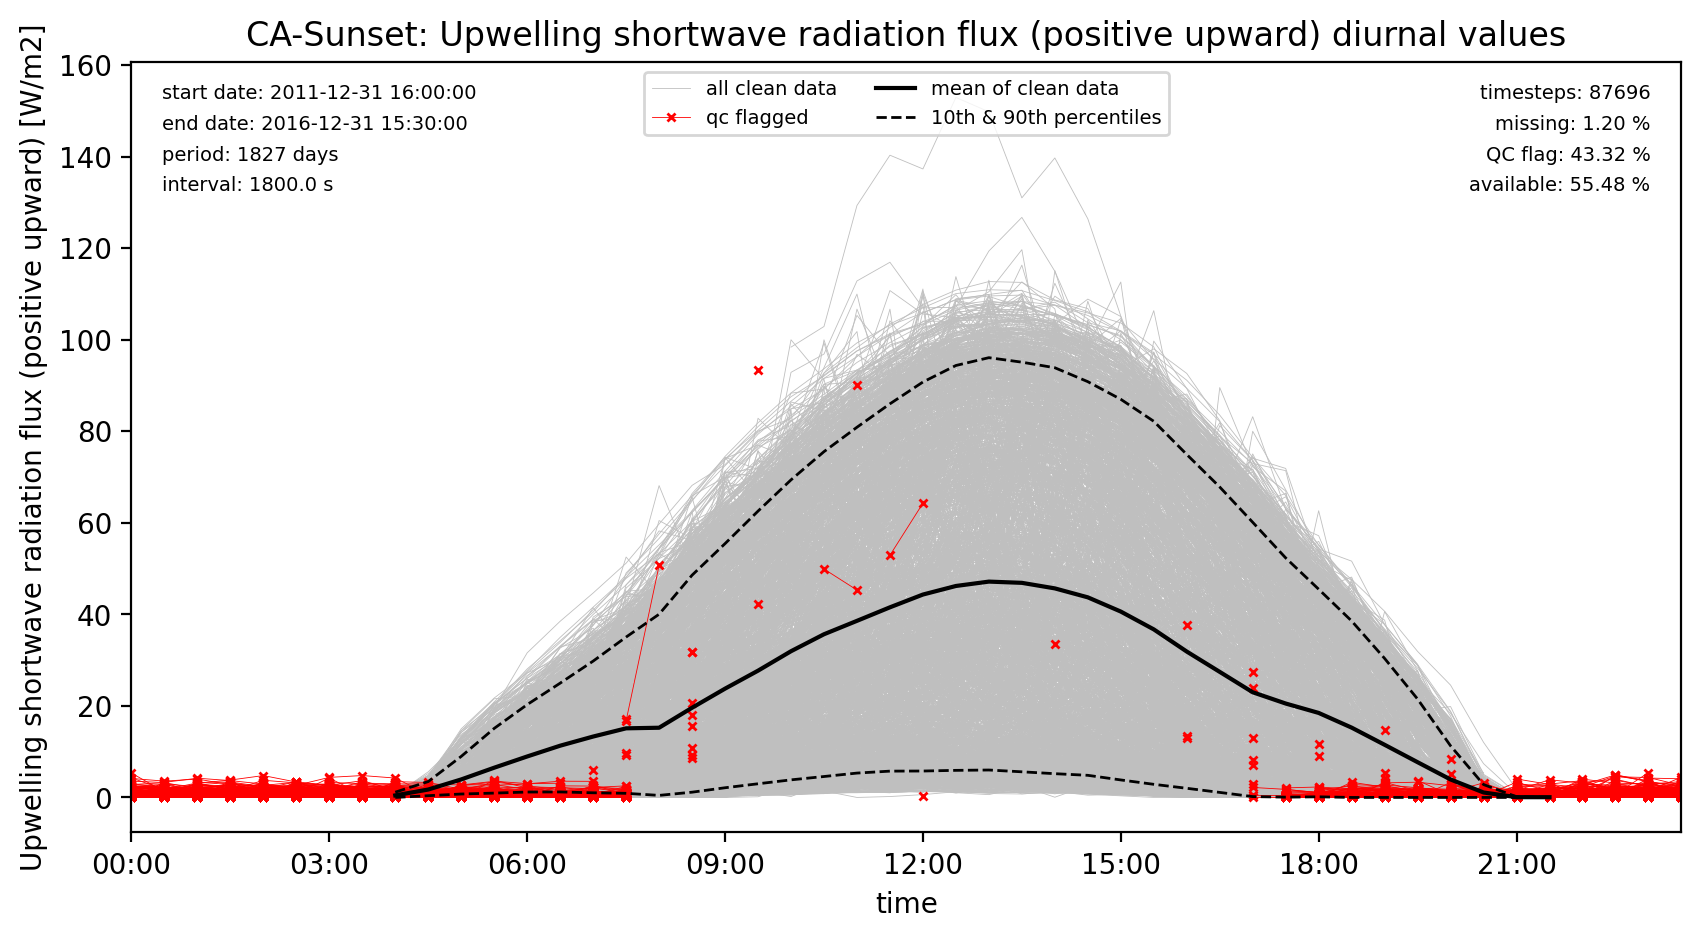
SWup diurnal qc
Snowf diurnal qc
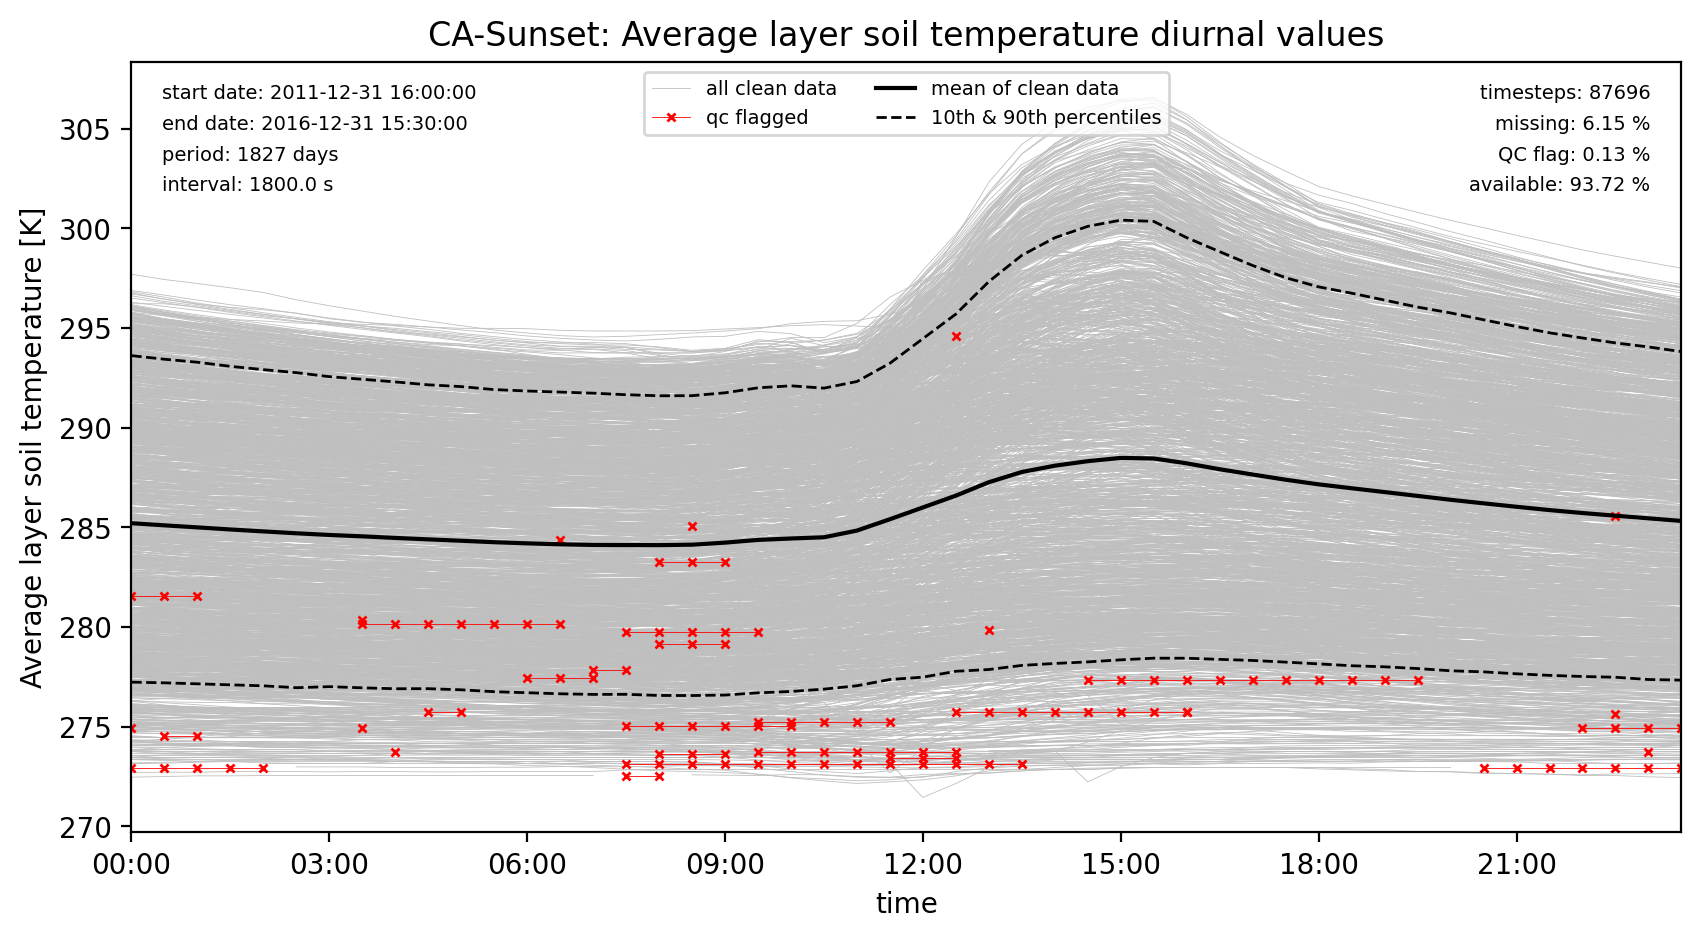
SoilTemp diurnal qc
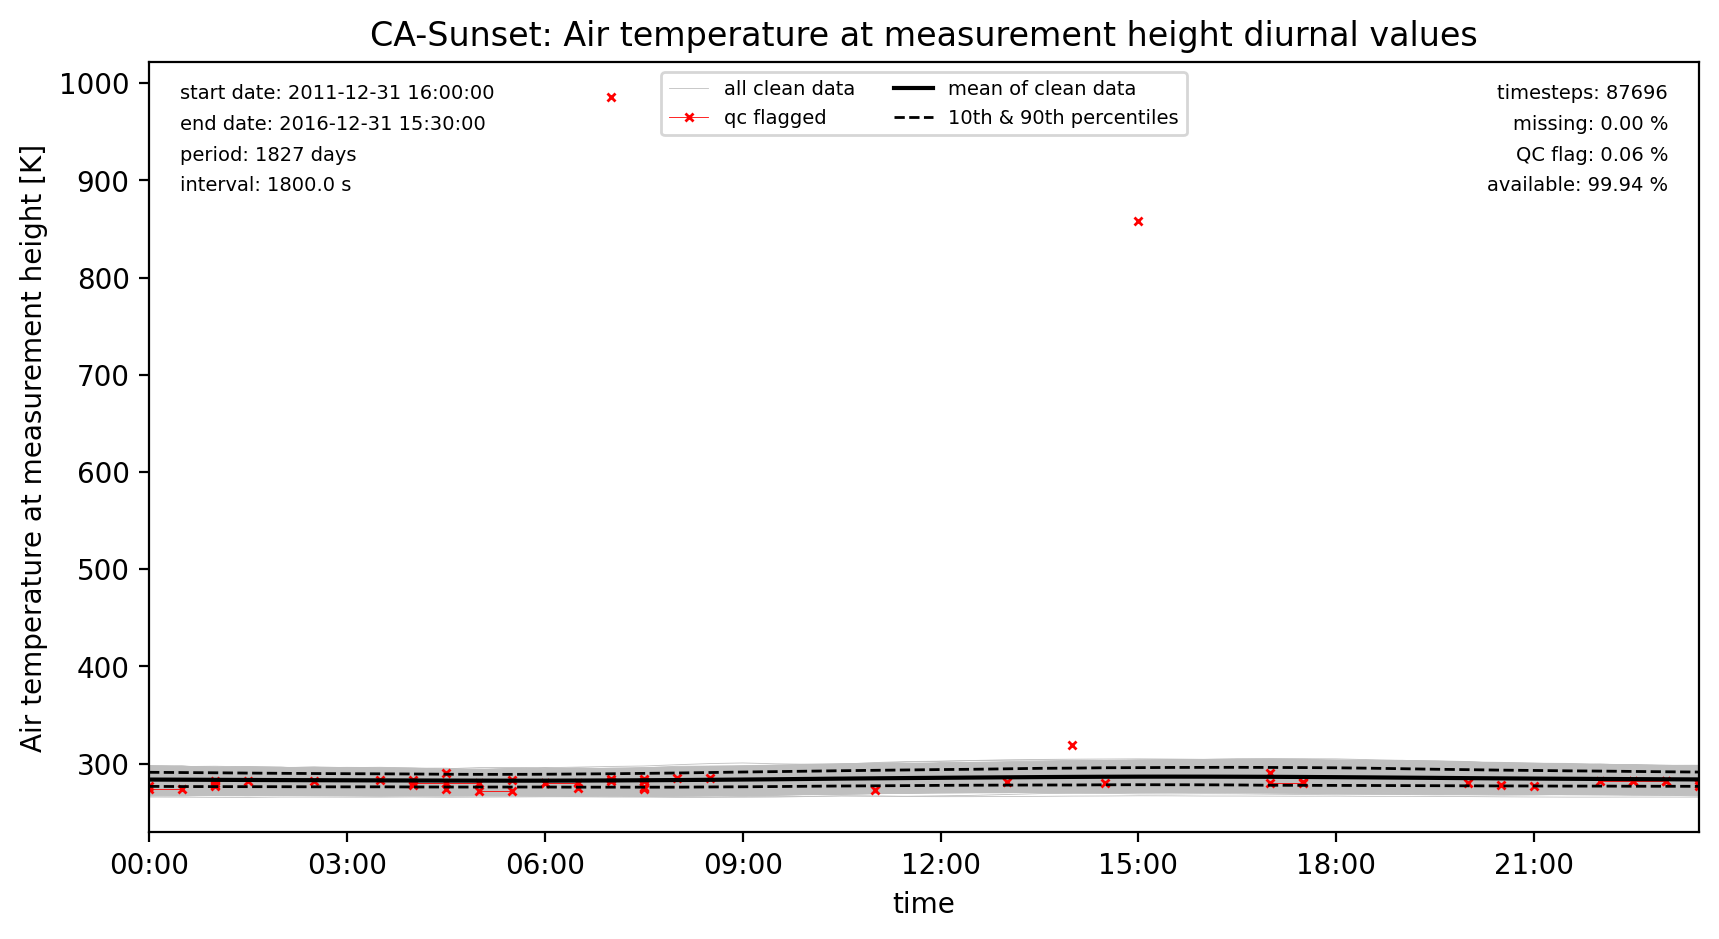
Tair diurnal qc
Wind_E diurnal qc
Wind_N diurnal qc
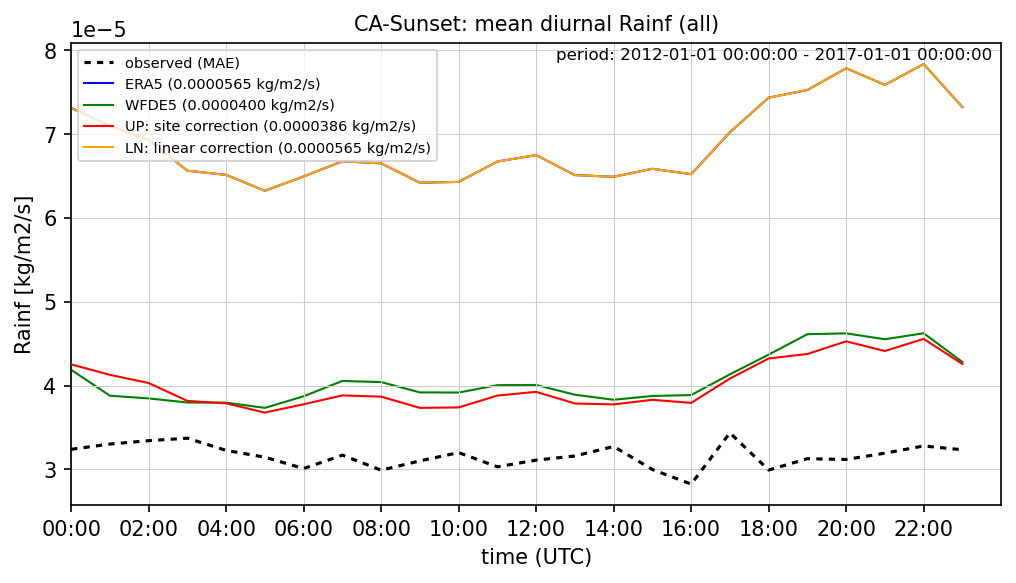
Bias correction diurnal comparison
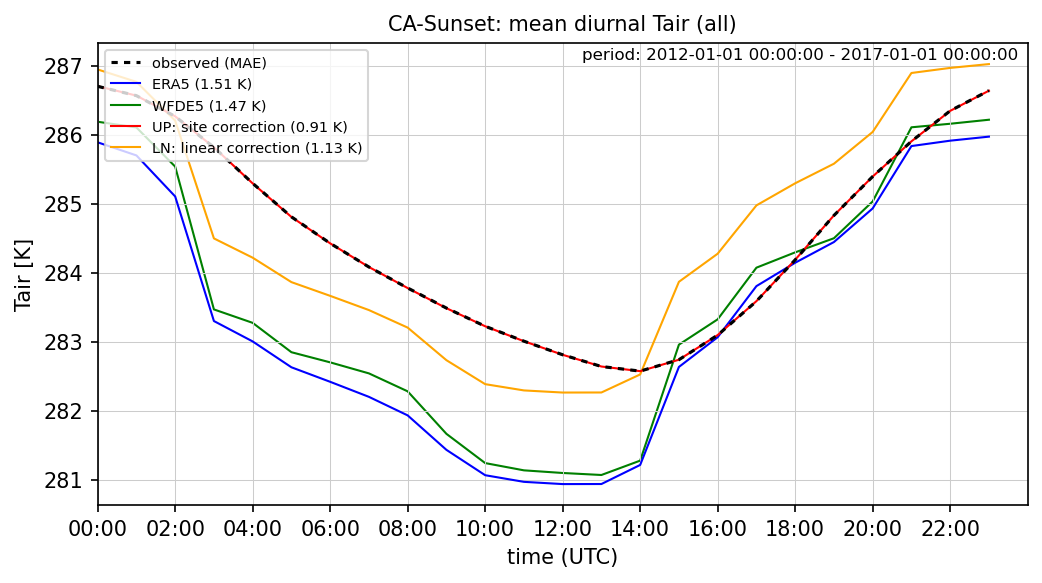
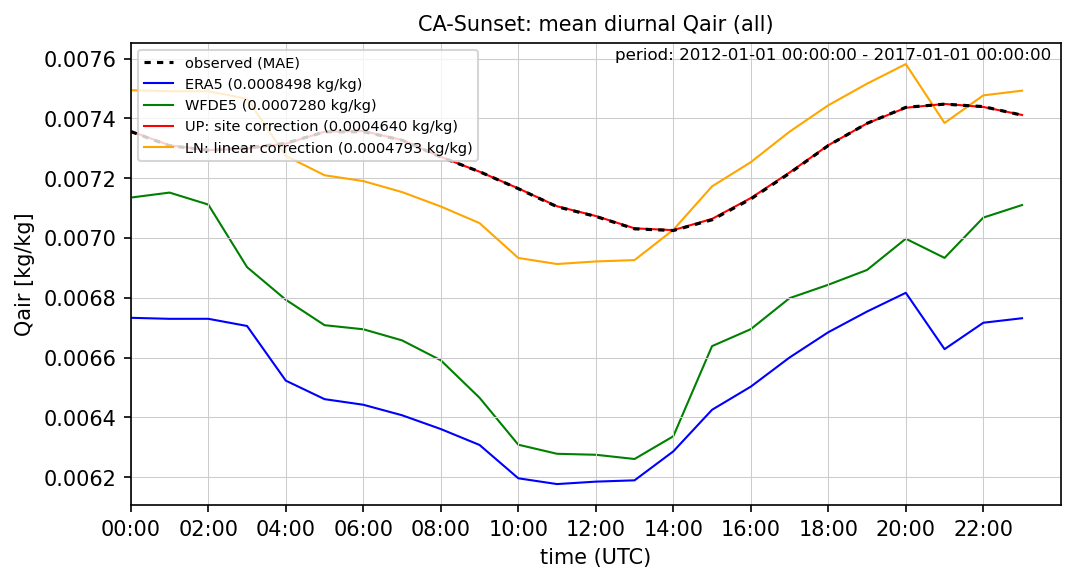
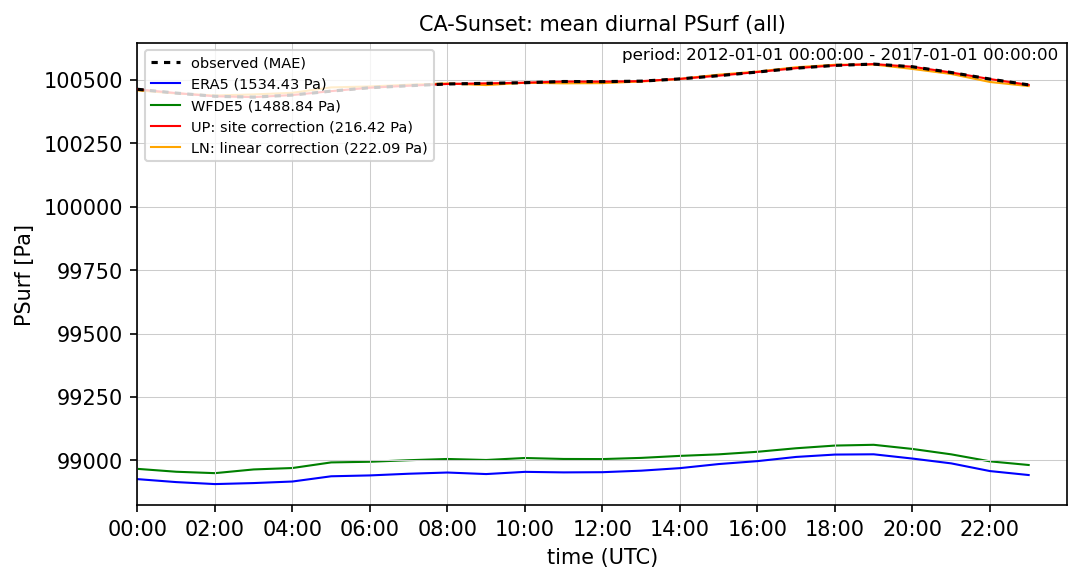
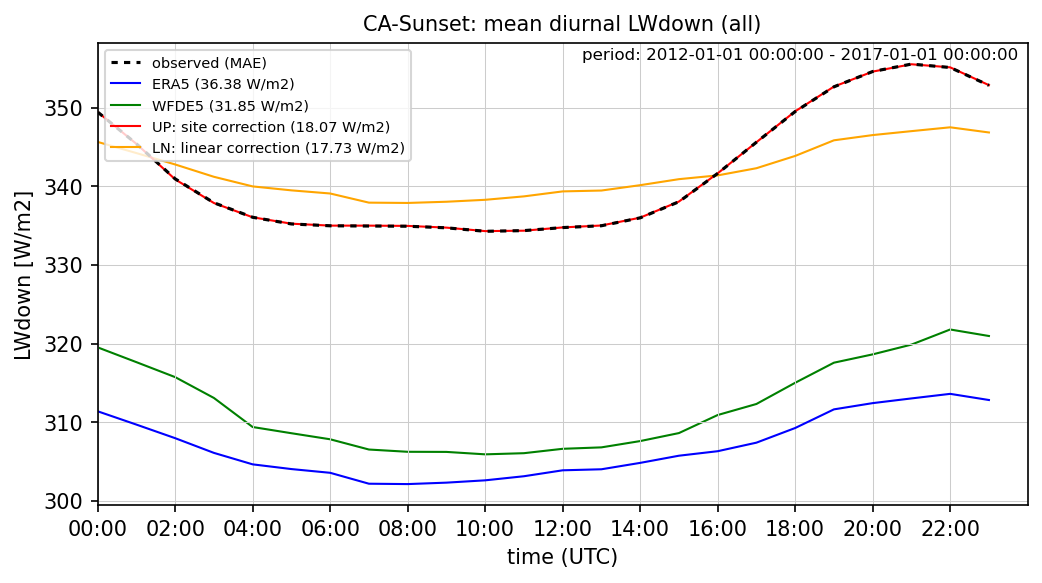
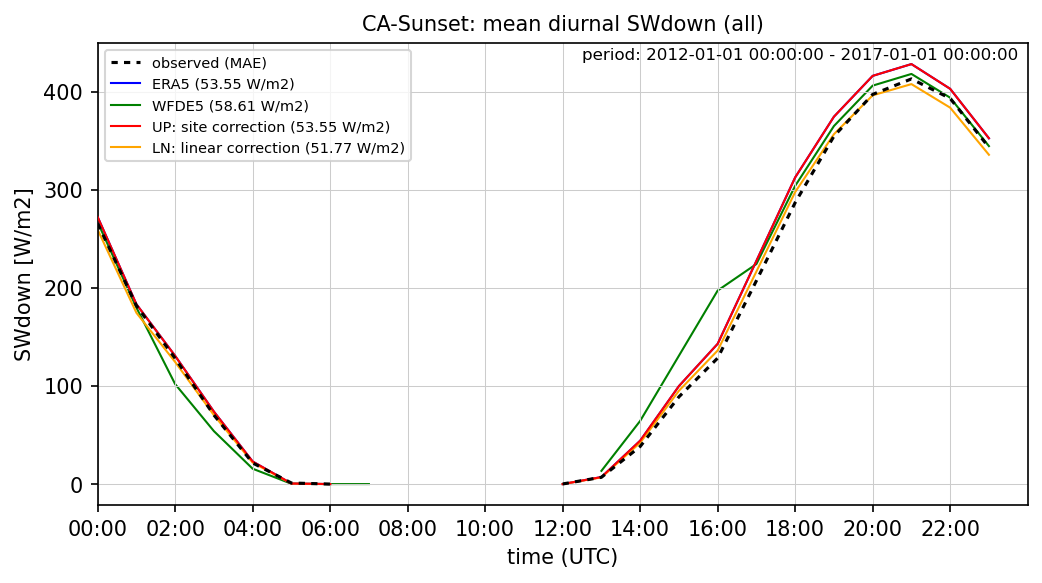
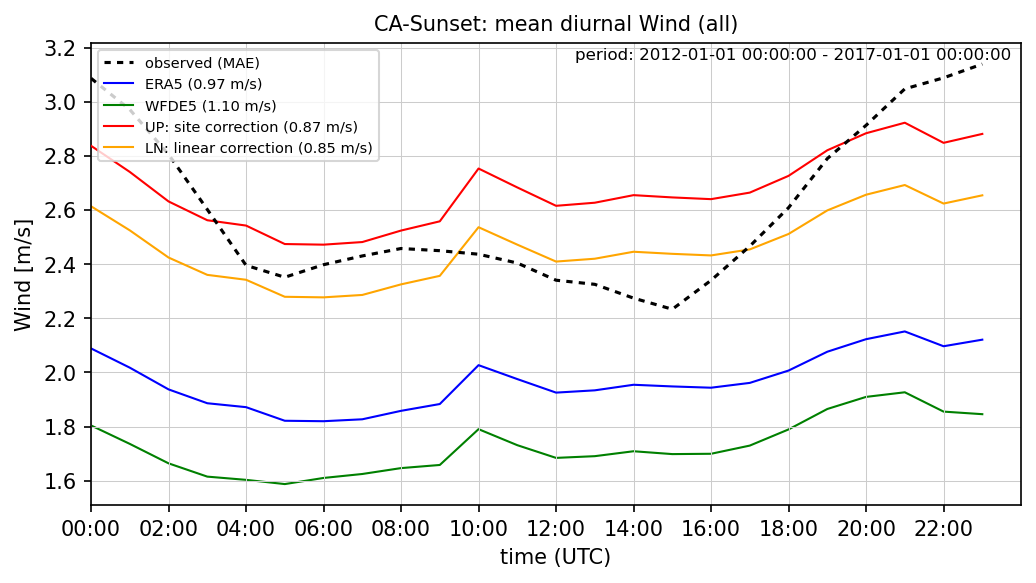
Four methods drawing on ERA5 reanalysis are compared relative to the quality-controlled flux tower data. The methods are:
- ERA5: the nearest land based 0.25° resolution ERA5 grid (i.e. without bias correction)
- WFDE5: the nearest WFDE5 grid (which use 0.5° gridded monthly observations for bias correction)
- UP: the Urban-PLUMBER methods used in this collection (using site observations for bias correction)
- LN: linear methods based on FLUXNET2015 (using site observations for bias correction)
ERA5 bias correction
The UP methods are as follows:
- for downwelling longwave, temperature, humidity and pressure: calculate the mean bias between ERA5 and flux tower data in a 30-day rolling window for every hour and each day of the year, apply that bias correction to all ERA5 data. For periods not covered by observations, linearly interpolate between known biases for each hour separately.
- for precipitation: calculate total precipitation in a 10-year period and calculate the ratio between ERA5 data and the nearest GHCN-D station and apply that correction factor to ERA5 data.
- for wind: apply wind log profile correction from ERA5 10m wind to tower measurement height using site roughness and displacement, with original grid roughness iteratively revised so that mean corrected wind speed matches observation.
- for downwelling shortwave: use ERA5 data without correction
Mean absolute error (MAE) is shown in the legend.
Tair diurnal bias correction
Qair diurnal bias correction
PSurf diurnal bias correction
LWdown diurnal bias correction
SWdown diurnal bias correction
Wind diurnal bias correction
Rainf diurnal bias correction