KUOM Tall Tower, Minneapolis, Minnesota, United States (US-Minneapolis1)
Jump to section:
- Site forcing metadata
- Site images
- Site characteristics
- Site forcing
- Quality control and gap filling procedure
- Bias correction diurnal comparison
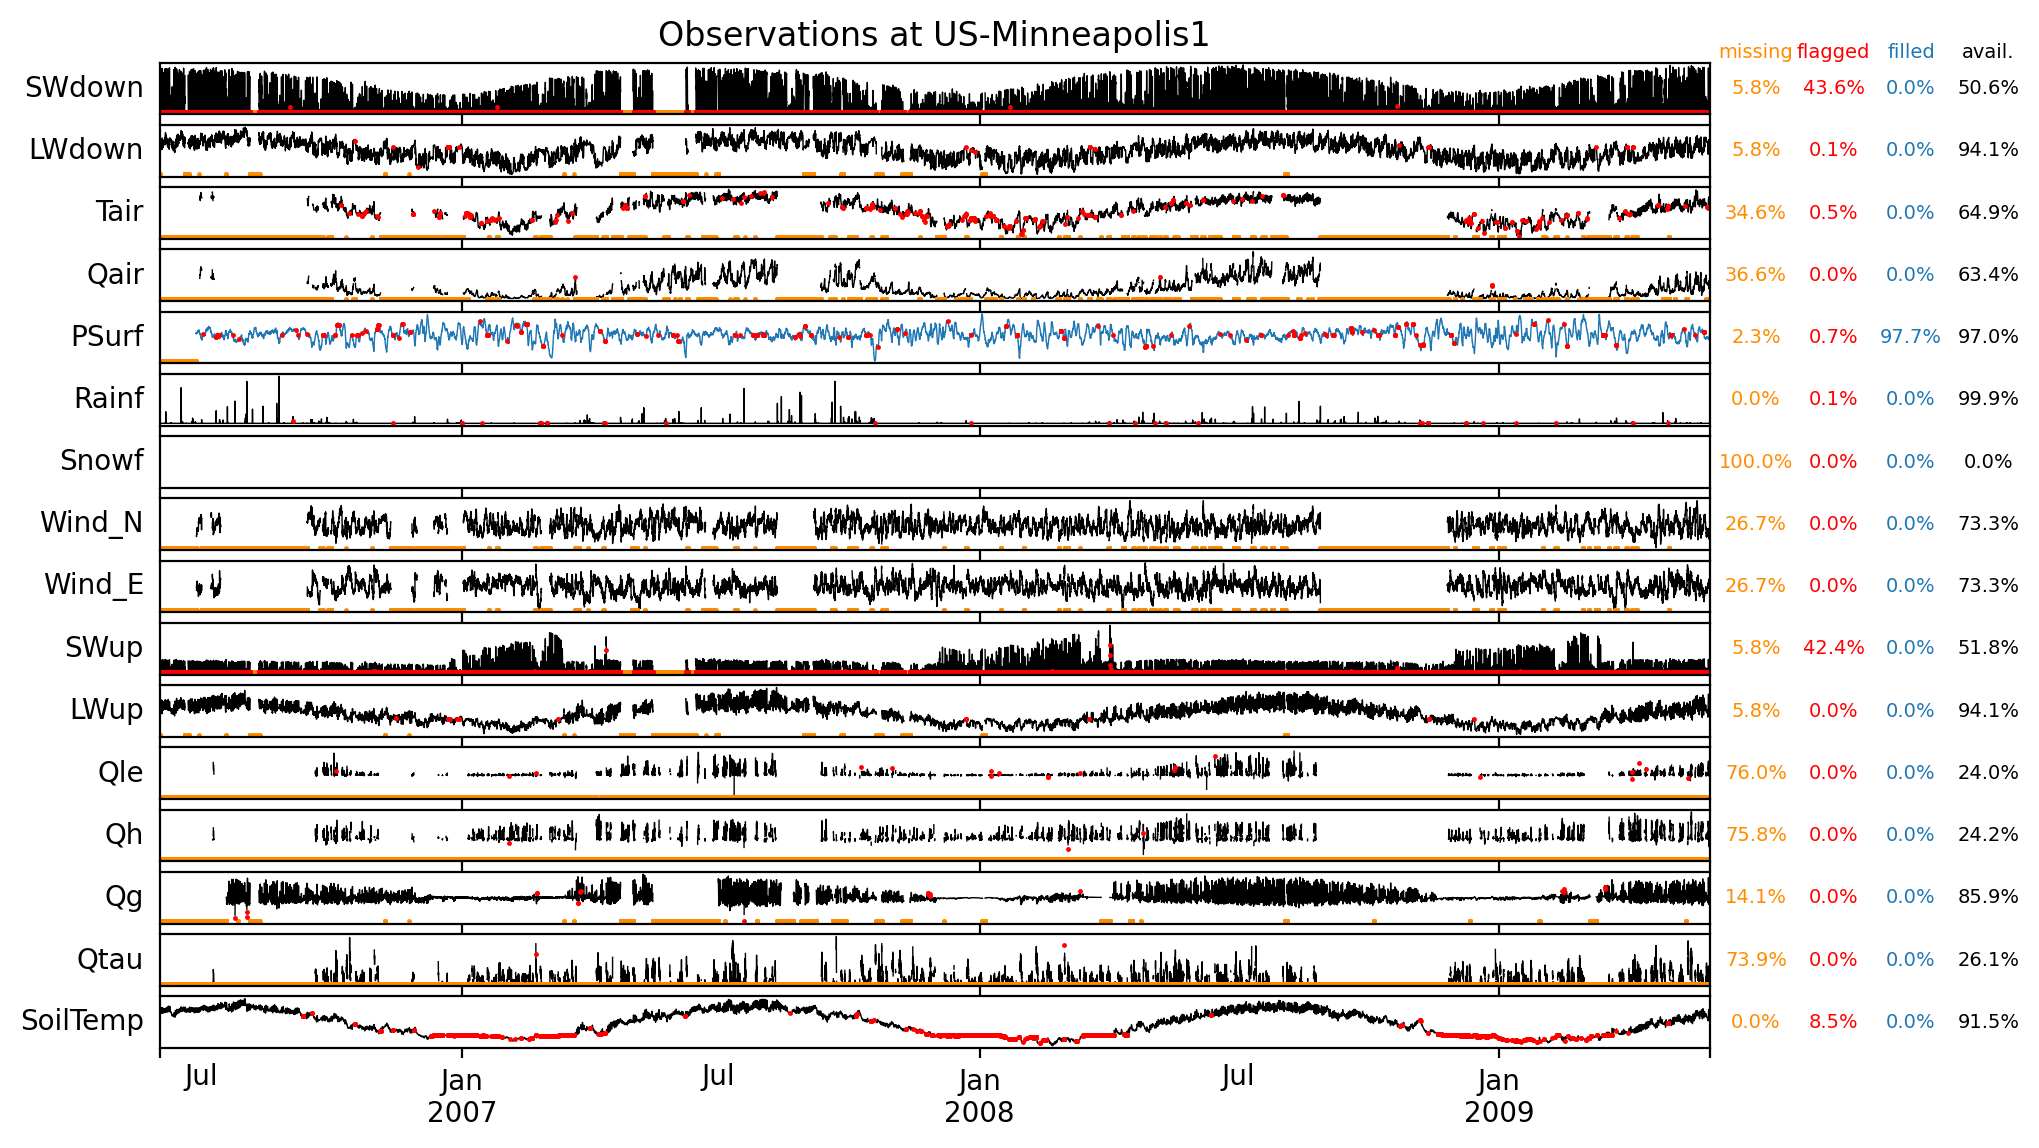
Observations (before additional gap filling)
Site forcing metadata
| observation_attributes | |
|---|---|
| title | Continuous meterological forcing from US-Minneapolis1 |
| summary | Flux tower observations from KUOM Tall Tower, Minneapolis, Minnesota, United States after quality control, with gap filling from bias corrected ERA5 surface meteorological data. Developed for use in the Urban-PLUMBER model evaluation project. Attribute any use to “Harmonized, gap-filled dataset from 20 urban flux tower sites” |
| sitename | US-Minneapolis1 |
| long_sitename | KUOM Tall Tower, Minneapolis, Minnesota, United States |
| version | v1 |
| keywords | urban, flux tower, eddy covariance, observations |
| conventions | ALMA, CF, ACDD-1.3 |
| featureType | timeSeries |
| license | CC-BY-4.0: https://creativecommons.org/licenses/by/4.0/ |
| time_coverage_start | 1996-01-01 00:00:00 |
| time_coverage_end | 2009-05-29 13:00:00 |
| time_analysis_start | 2006-06-01 18:00:00 |
| time_shown_in | UTC |
| local_utc_offset_hours | -6.0 |
| timestep_interval_seconds | 1800.0 |
| timestep_number_spinup | 182628 |
| timestep_number_analysis | 52455 |
| project | Urban-PLUMBER multi-site model evaluation project for urban areas |
| references | Data from “Harmonized gap-filled dataset from 20 urban flux tower sites”: https://doi.org/10.5281/zenodo.5517550 |
| project_contact | Mathew Lipson (m.lipson@unsw.edu.au), Sue Grimmond (c.s.grimmond@reading.ac.uk), Martin Best (martin.best@metoffice.gov.uk) |
| observations_contact | Joe McFadden (mcfadden@ucsb.edu) University of California, Santa Barbara |
| observations_reference | Peters, Hiller, McFadden (2011): https://doi.org/10.1029/2010JG001463; Menzer and McFadden (2017): https://doi.org/10.1016/j.atmosenv.2017.09.049 |
| date_created | 2022-09-22 16:49:15 |
| source | https://github.com/matlipson/urban-plumber_pipeline |
| other_references | ERA5: Copernicus Climate Change Service (C3S) (2017): https://cds.climate.copernicus.eu/cdsapp#!/home NCI Australia: http://doi.org/10.25914/5f48874388857 |
| acknowledgements | Contains modified Copernicus Climate Change Service Information 2021 (ERA5 hourly data on single levels). Data from replica hosted by NCI Australia. |
| comment | Residential sectors (285°-75°) of Minneapolis KUOM tower. Air pressure (PSurf) from Minneapolis-Saint Paul International Airport. Radiation components (SWdown,SWup,LWdown,LWup) measured at 2 m above ground level, not from tower as other variables. SoilTemp at 5cm depth. Tower fluxes from original dataset which are flagged 2 excluded. |
| history | v0.9 (2021-09-08): beta issue; v1 (2022-09-15): with publication in ESSD |
Site images
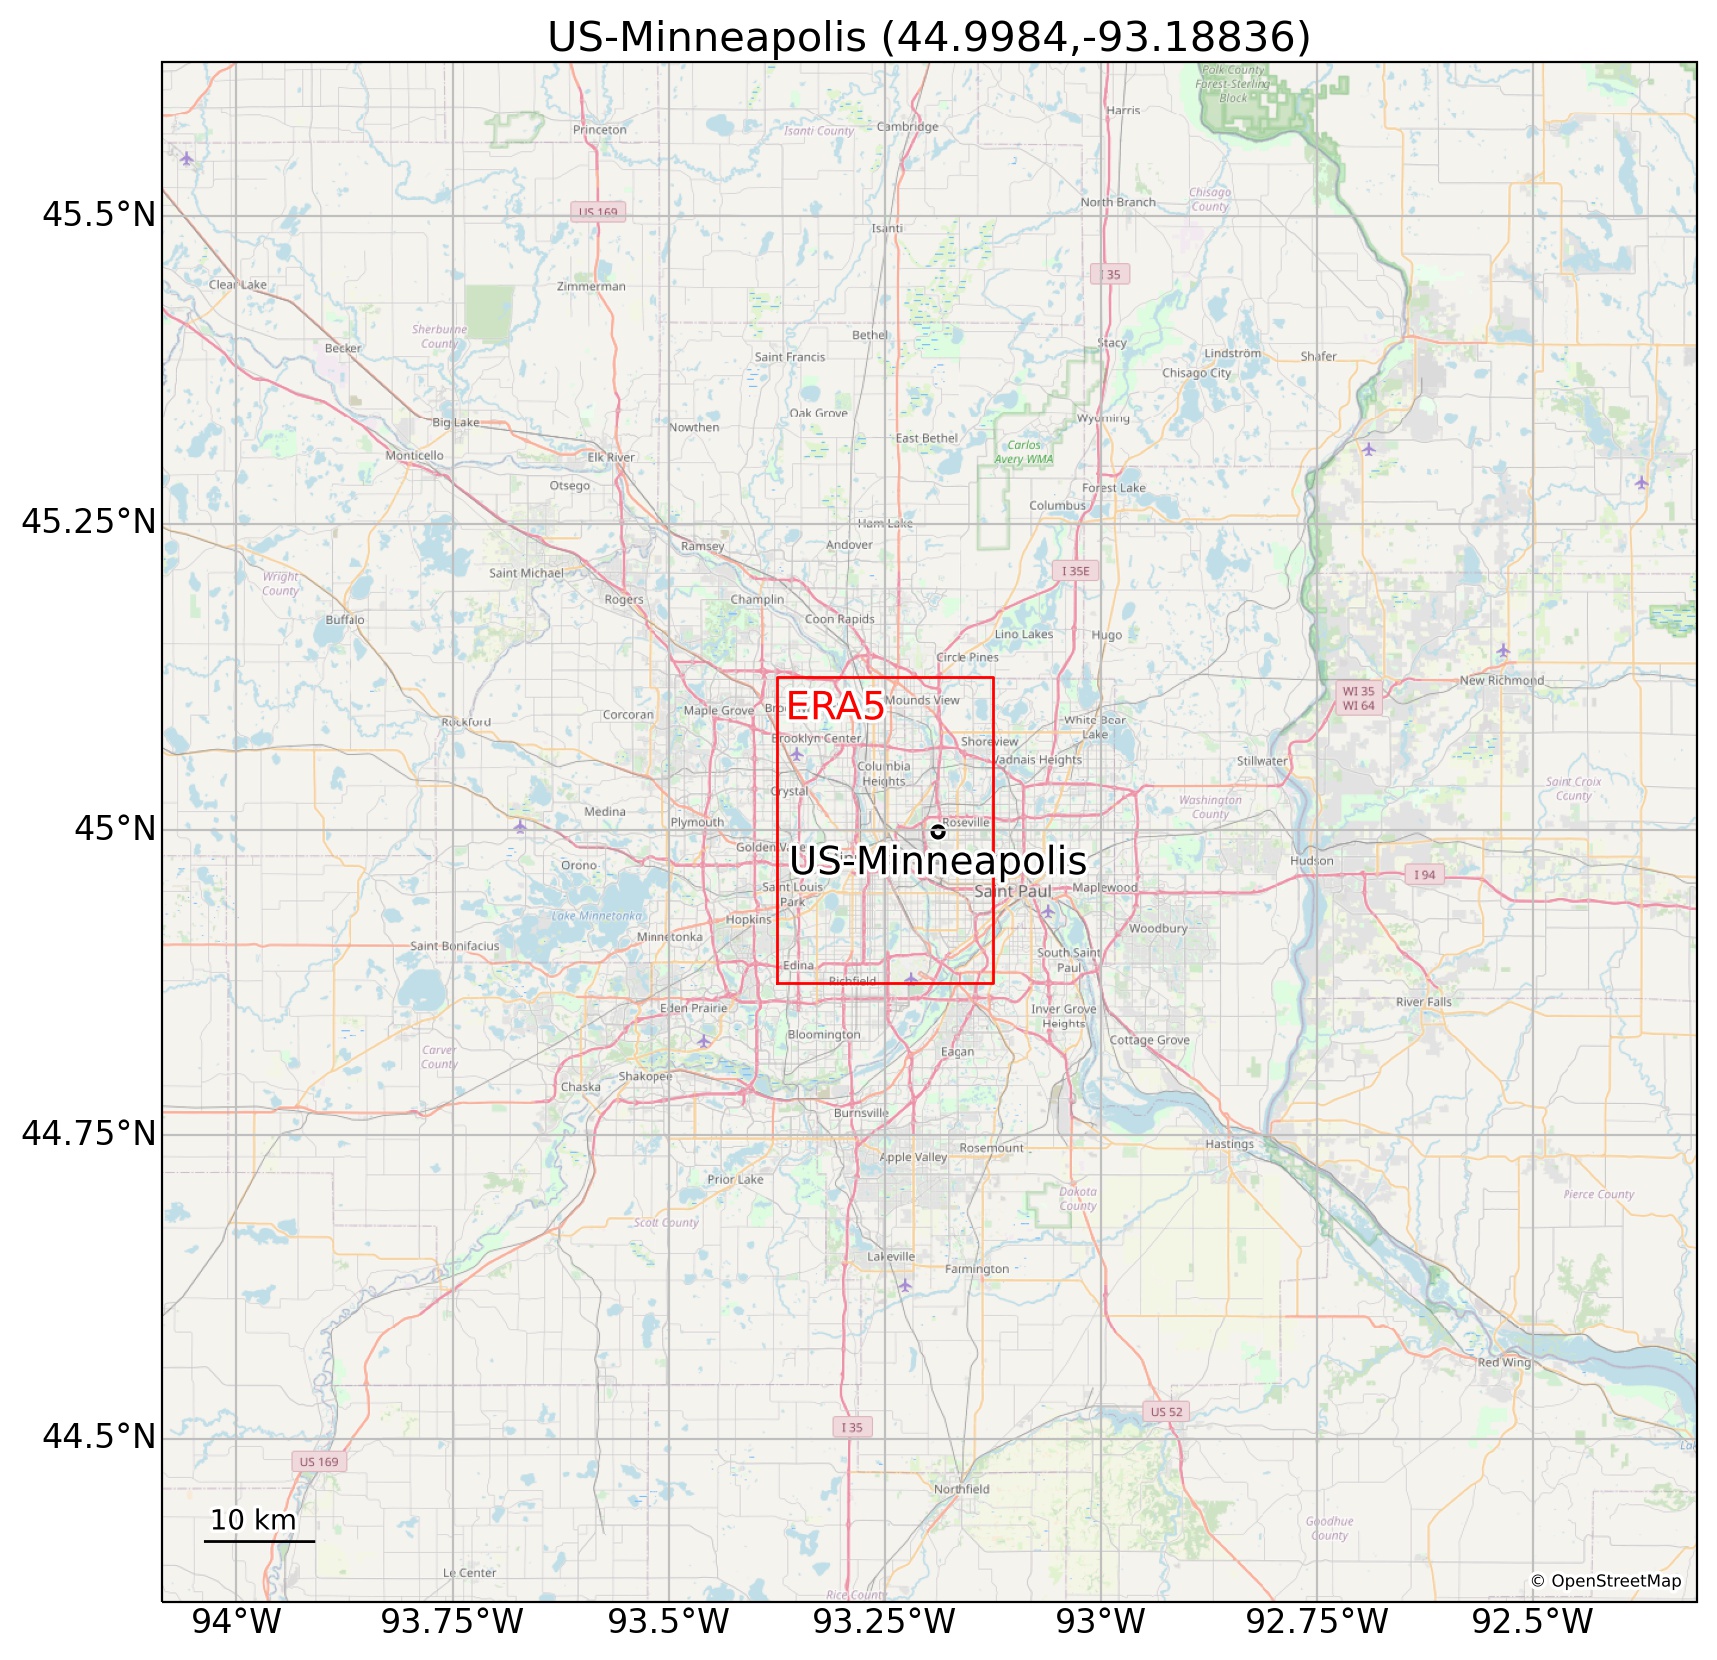 Regional map. © OpenStreetMap Regional map. © OpenStreetMap |
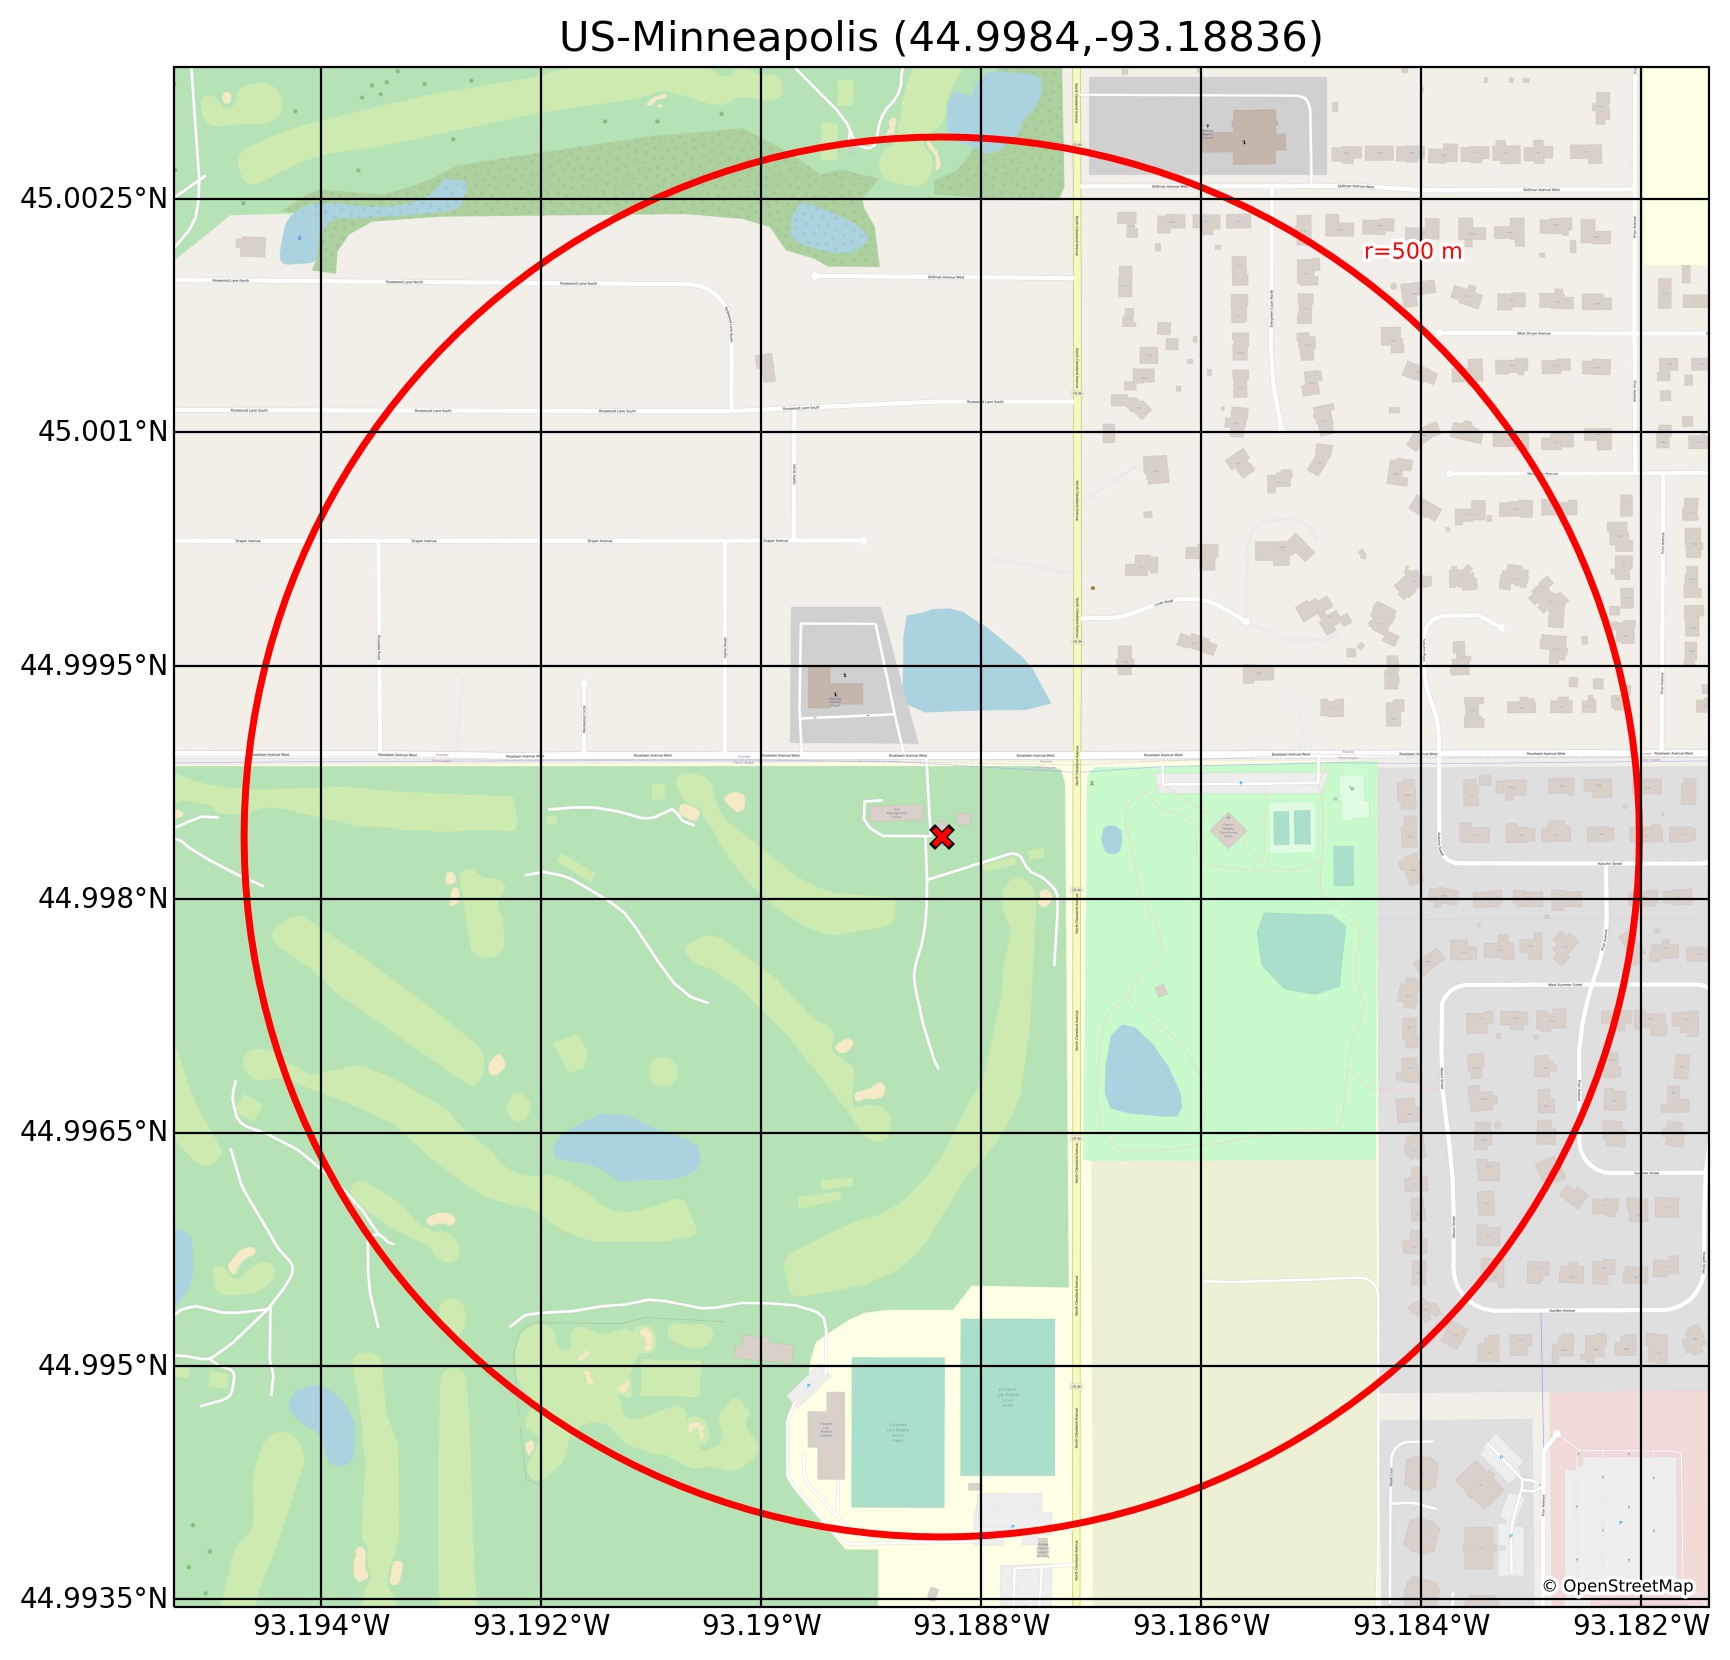 Site map with 500 m radius. © OpenStreetMap Site map with 500 m radius. © OpenStreetMap |
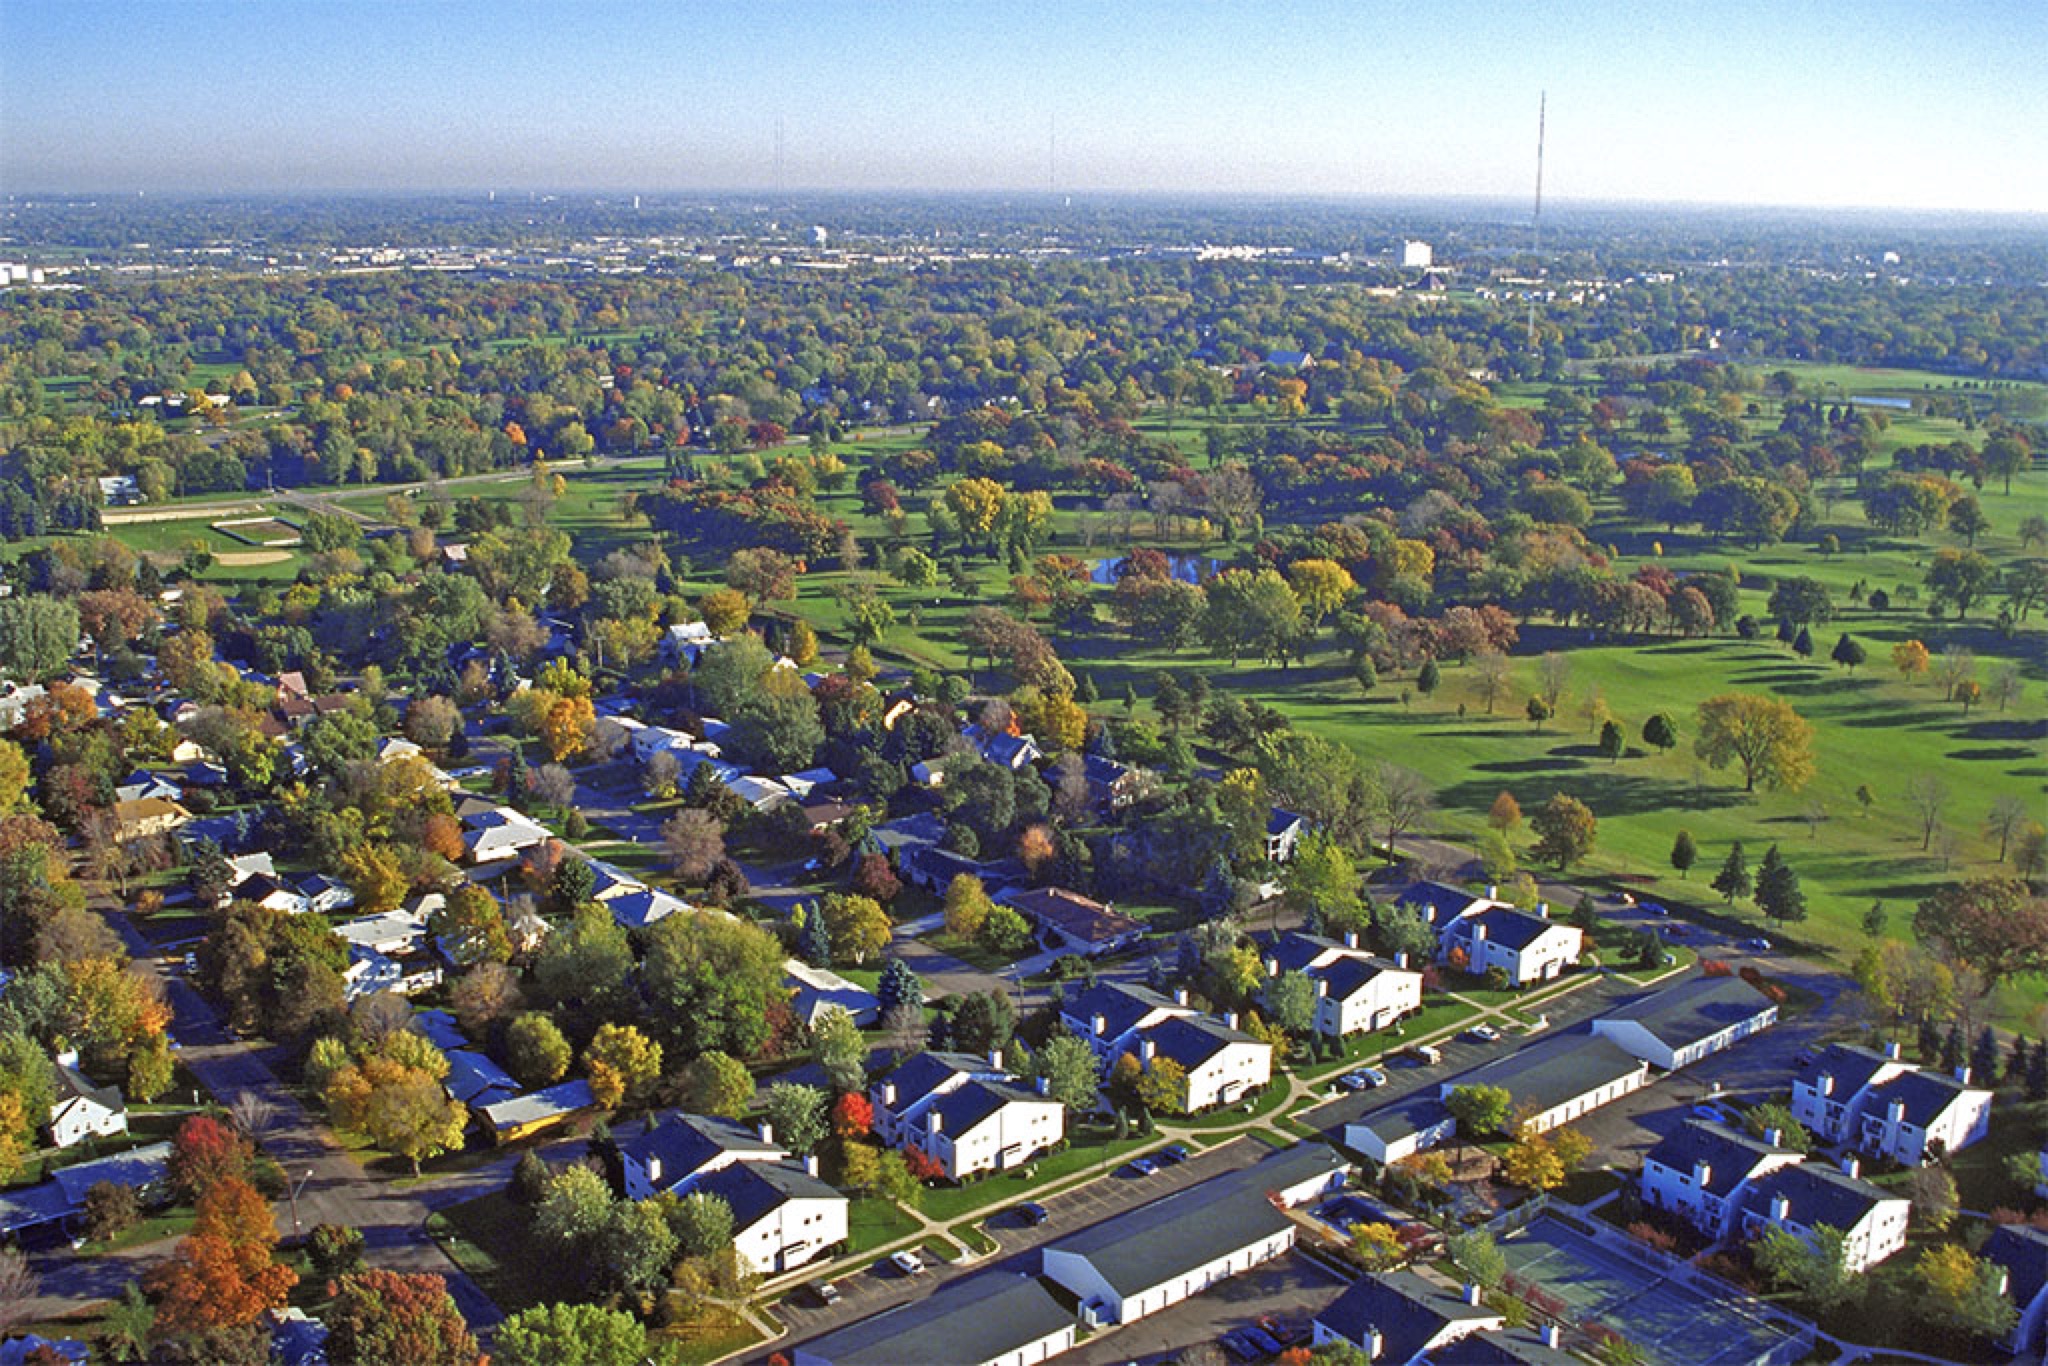 Site photo. © J. McFadden Site photo. © J. McFadden |
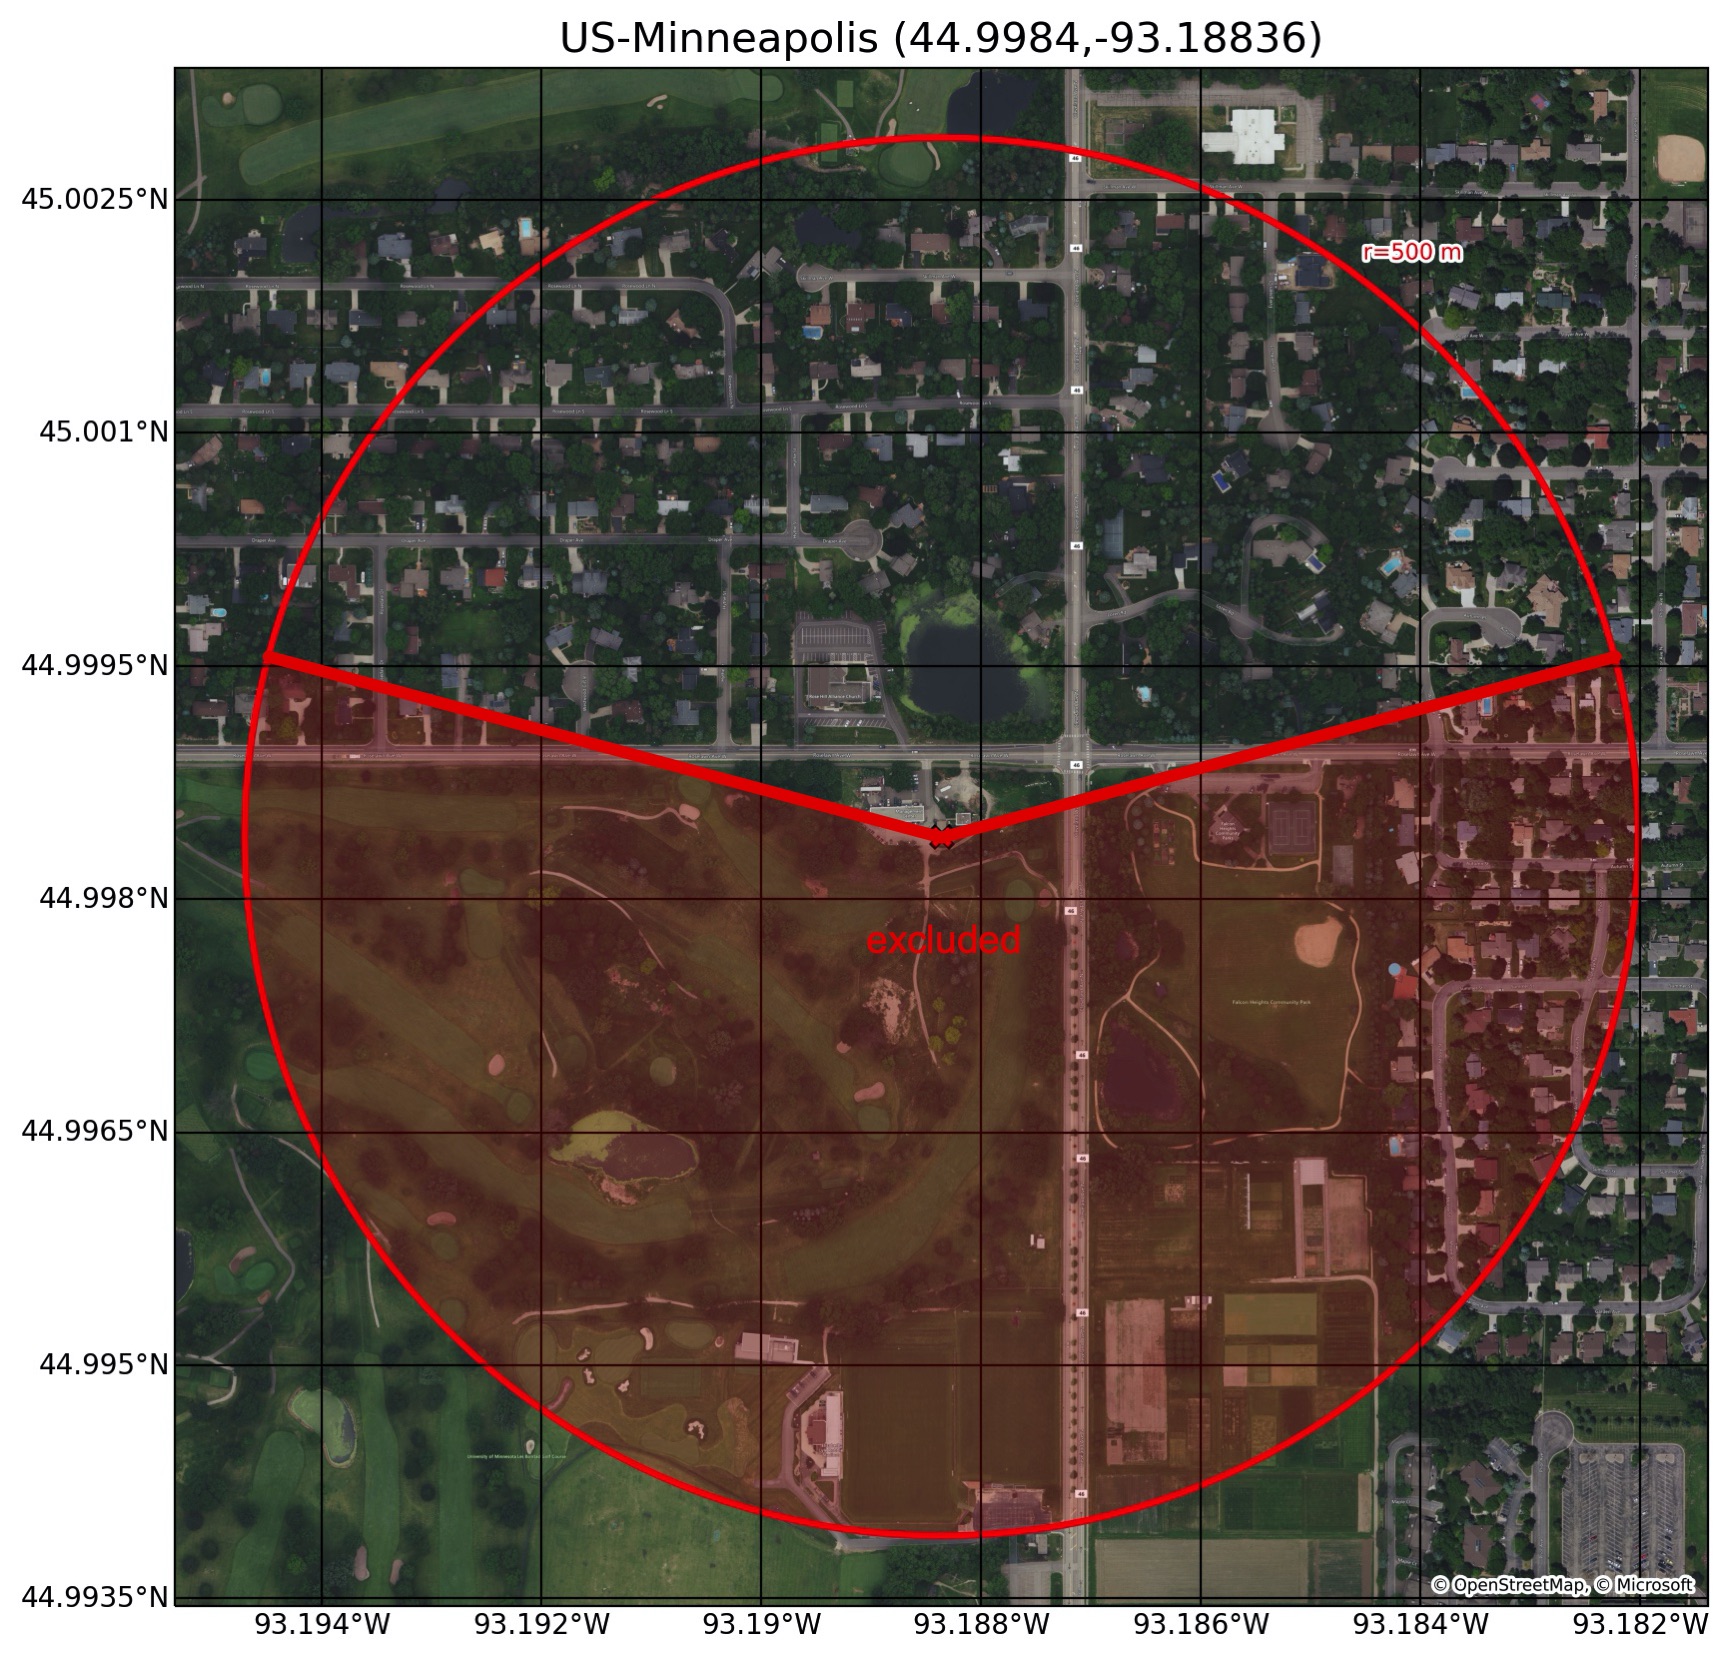 Site aerial photo with 500 m radius. © OpenStreetMap, Microsoft Site aerial photo with 500 m radius. © OpenStreetMap, Microsoft |
Maps developed from: Hrisko, J. (2020). Geographic Visualizations in Python with Cartopy. Maker Portal.
Site characteristics
| id | parameter | value | units | source | doi |
|---|---|---|---|---|---|
| 1 | latitude | 44.9984 | degrees_north | Peters et al. (2011) | https://doi.org/10.1029/2010JG001463 |
| 2 | longitude | -93.1884 | degrees_east | Peters et al. (2011) | https://doi.org/10.1029/2010JG001463 |
| 3 | ground_height | 301 | m | site metadata | https://ameriflux.lbl.gov/sites/siteinfo/US-KUO#overview |
| 4 | measurement_height_above_ground | 40 | m | Peters et al. (2011) | https://doi.org/10.1029/2010JG001463 |
| 5 | impervious_area_fraction | 0.21 | 1 | weighted footprint fraction | https://ameriflux.lbl.gov/sites/siteinfo/US-KUO#overview |
| 6 | tree_area_fraction | 0.38 | 1 | weighted footprint fraction | https://ameriflux.lbl.gov/sites/siteinfo/US-KUO#overview |
| 7 | grass_area_fraction | 0.36 | 1 | weighted footprint fraction | https://ameriflux.lbl.gov/sites/siteinfo/US-KUO#overview |
| 8 | bare_soil_area_fraction | 0 | 1 | weighted footprint fraction | https://ameriflux.lbl.gov/sites/siteinfo/US-KUO#overview |
| 9 | water_area_fraction | 0.05 | 1 | weighted footprint fraction | https://ameriflux.lbl.gov/sites/siteinfo/US-KUO#overview |
| 10 | roof_area_fraction | 0.12 | 1 | Jarvi et al. 2017 (supplemental) | https://doi.org/10.1038/s41598-017-05733-y |
| 11 | road_area_fraction | 0.05 | 1 | Jarvi et al. 2017 (supplemental) | https://doi.org/10.1038/s41598-017-05733-y |
| 12 | other_paved_area_fraction | 0.04 | 1 | Jarvi et al. 2017 (supplemental) | https://doi.org/10.1038/s41598-017-05733-y |
| 13 | building_mean_height | 5.05 | m | McFadden, pers. comms. | calculated from LiDAR data within full footprint |
| 14 | tree_mean_height | 12 | m | Peters et al. (2011) | https://doi.org/10.1029/2010JG001463 |
| 15 | roughness_length_momentum | 0.41 | m | estimate, see notes | derived from morphology, including vegetation, using Kent et al. 2017 |
| 16 | displacement_height | 3.09 | m | estimate, see notes | derived from morphology, including vegetation, using Kent et al. 2017 |
| 17 | canyon_height_width_ratio | 0.05 | 1 | estimated, see notes | derived from estimate of wall to plan area ratio and Eq. 1 from Masson et al. (2020) |
| 18 | wall_to_plan_area_ratio | 0.097 | 1 | estimated, see notes | derived from perimeter of building footprint (from satellite imagery) times estimated average building height |
| 19 | average_albedo_at_midday | 0.213 | 1 | median of observations | - |
| 20 | resident_population_density | 1125 | person/km2 | site metadata | https://ameriflux.lbl.gov/sites/siteinfo/US-KUO#overview |
| 21 | anthropogenic_heat_flux_mean | 1.8 | W/m2 | Varquez et al. (2021) | https://doi.org/10.1038/s41597-021-00850-w |
| 22 | topsoil_clay_fraction | 0.15 | 1 | OpenLandMap | https://doi.org/10.5281/zenodo.2525663 |
| 23 | topsoil_sand_fraction | 0.46 | 1 | OpenLandMap | https://doi.org/10.5281/zenodo.2525662 |
| 24 | topsoil_bulk_density | 1490 | kg/m3 | OpenLandMap | https://doi.org/10.5281/zenodo.2525665 |
| 25 | building_height_standard_deviation | 3.11 | m | McFadden, pers. comms. | calculated from LiDAR data within full footprint |
| 26 | roughness_length_momentum_mac | 0.12 | m | Macdonald method | derived from morphology using eq. 26 of Macdonald et al. (1998) |
| 27 | displacement_height_mac | 1.33 | m | Macdonald method | derived from morphology using eq. 23 of Macdonald et al. (1998) |
| 28 | roughness_length_momentum_kanda | 0.09 | m | Kanda method | derived from morphology using eq. 12a of Kanda et al. (2013) |
| 29 | displacement_height_kanda | 5.13 | m | Kanda method | derived from morphology using eq. 10a of Kanda et al. (2013) |
Site forcing
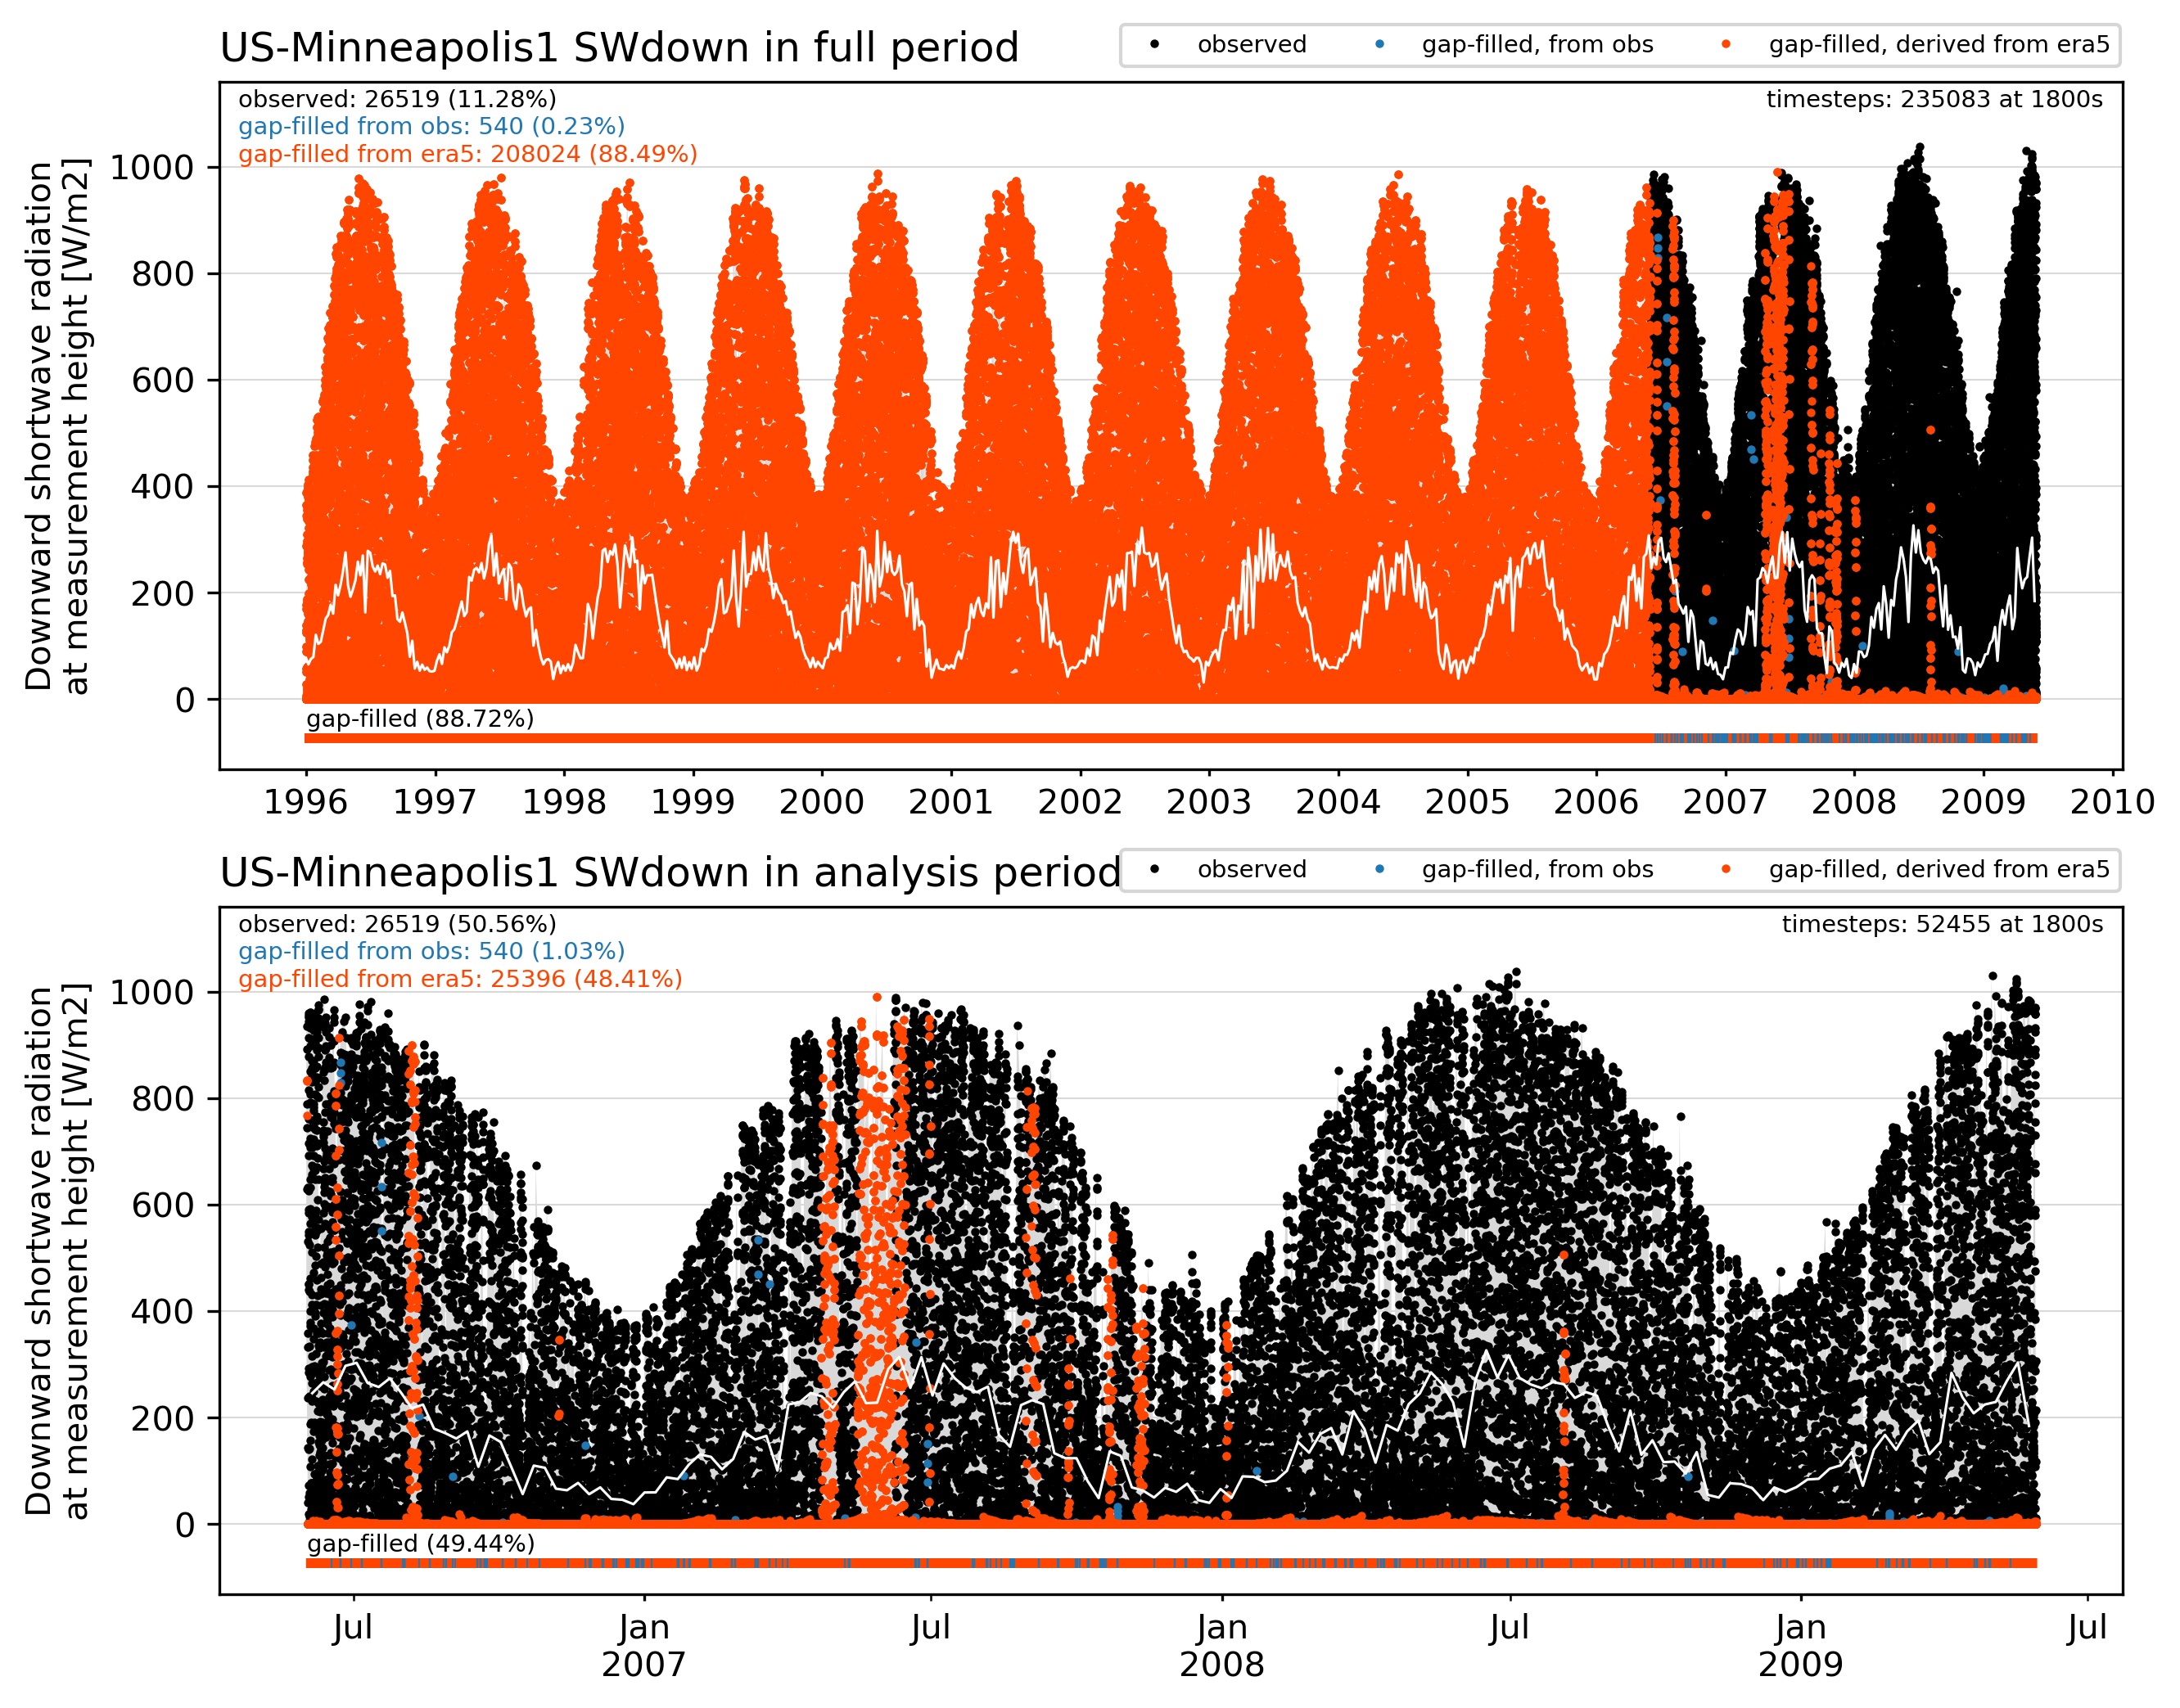
SWdown forcing
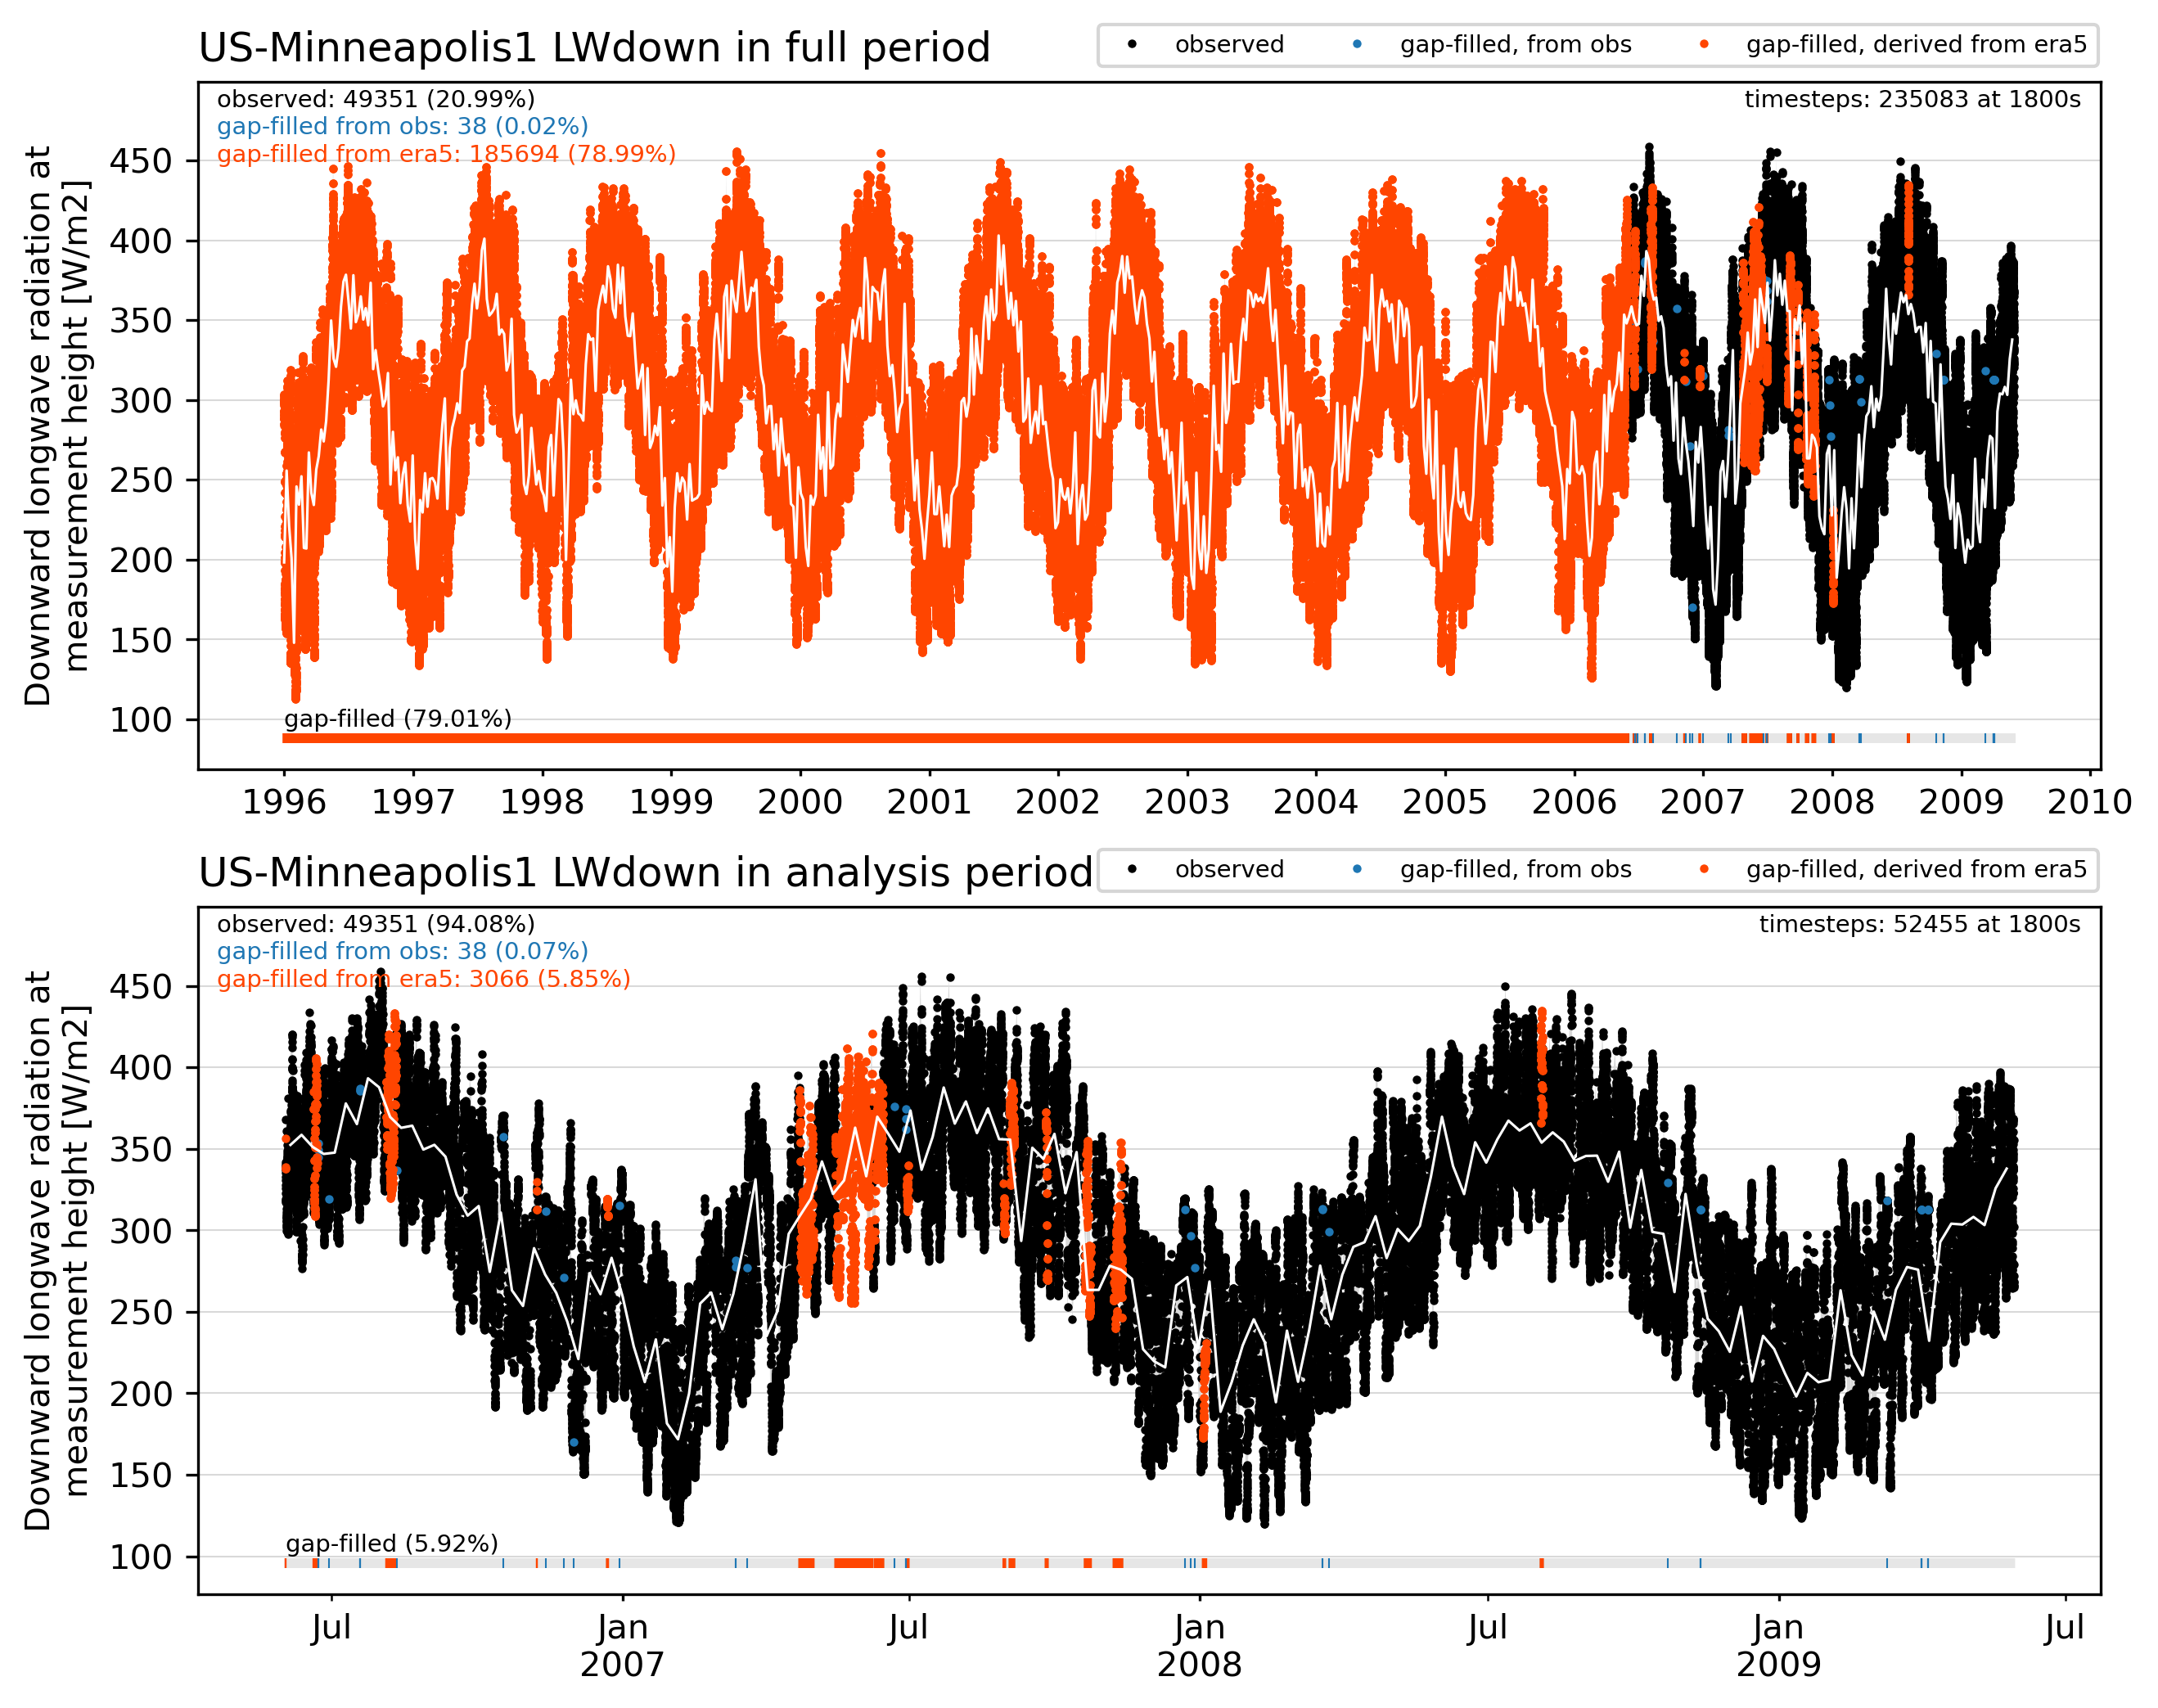
LWdown forcing
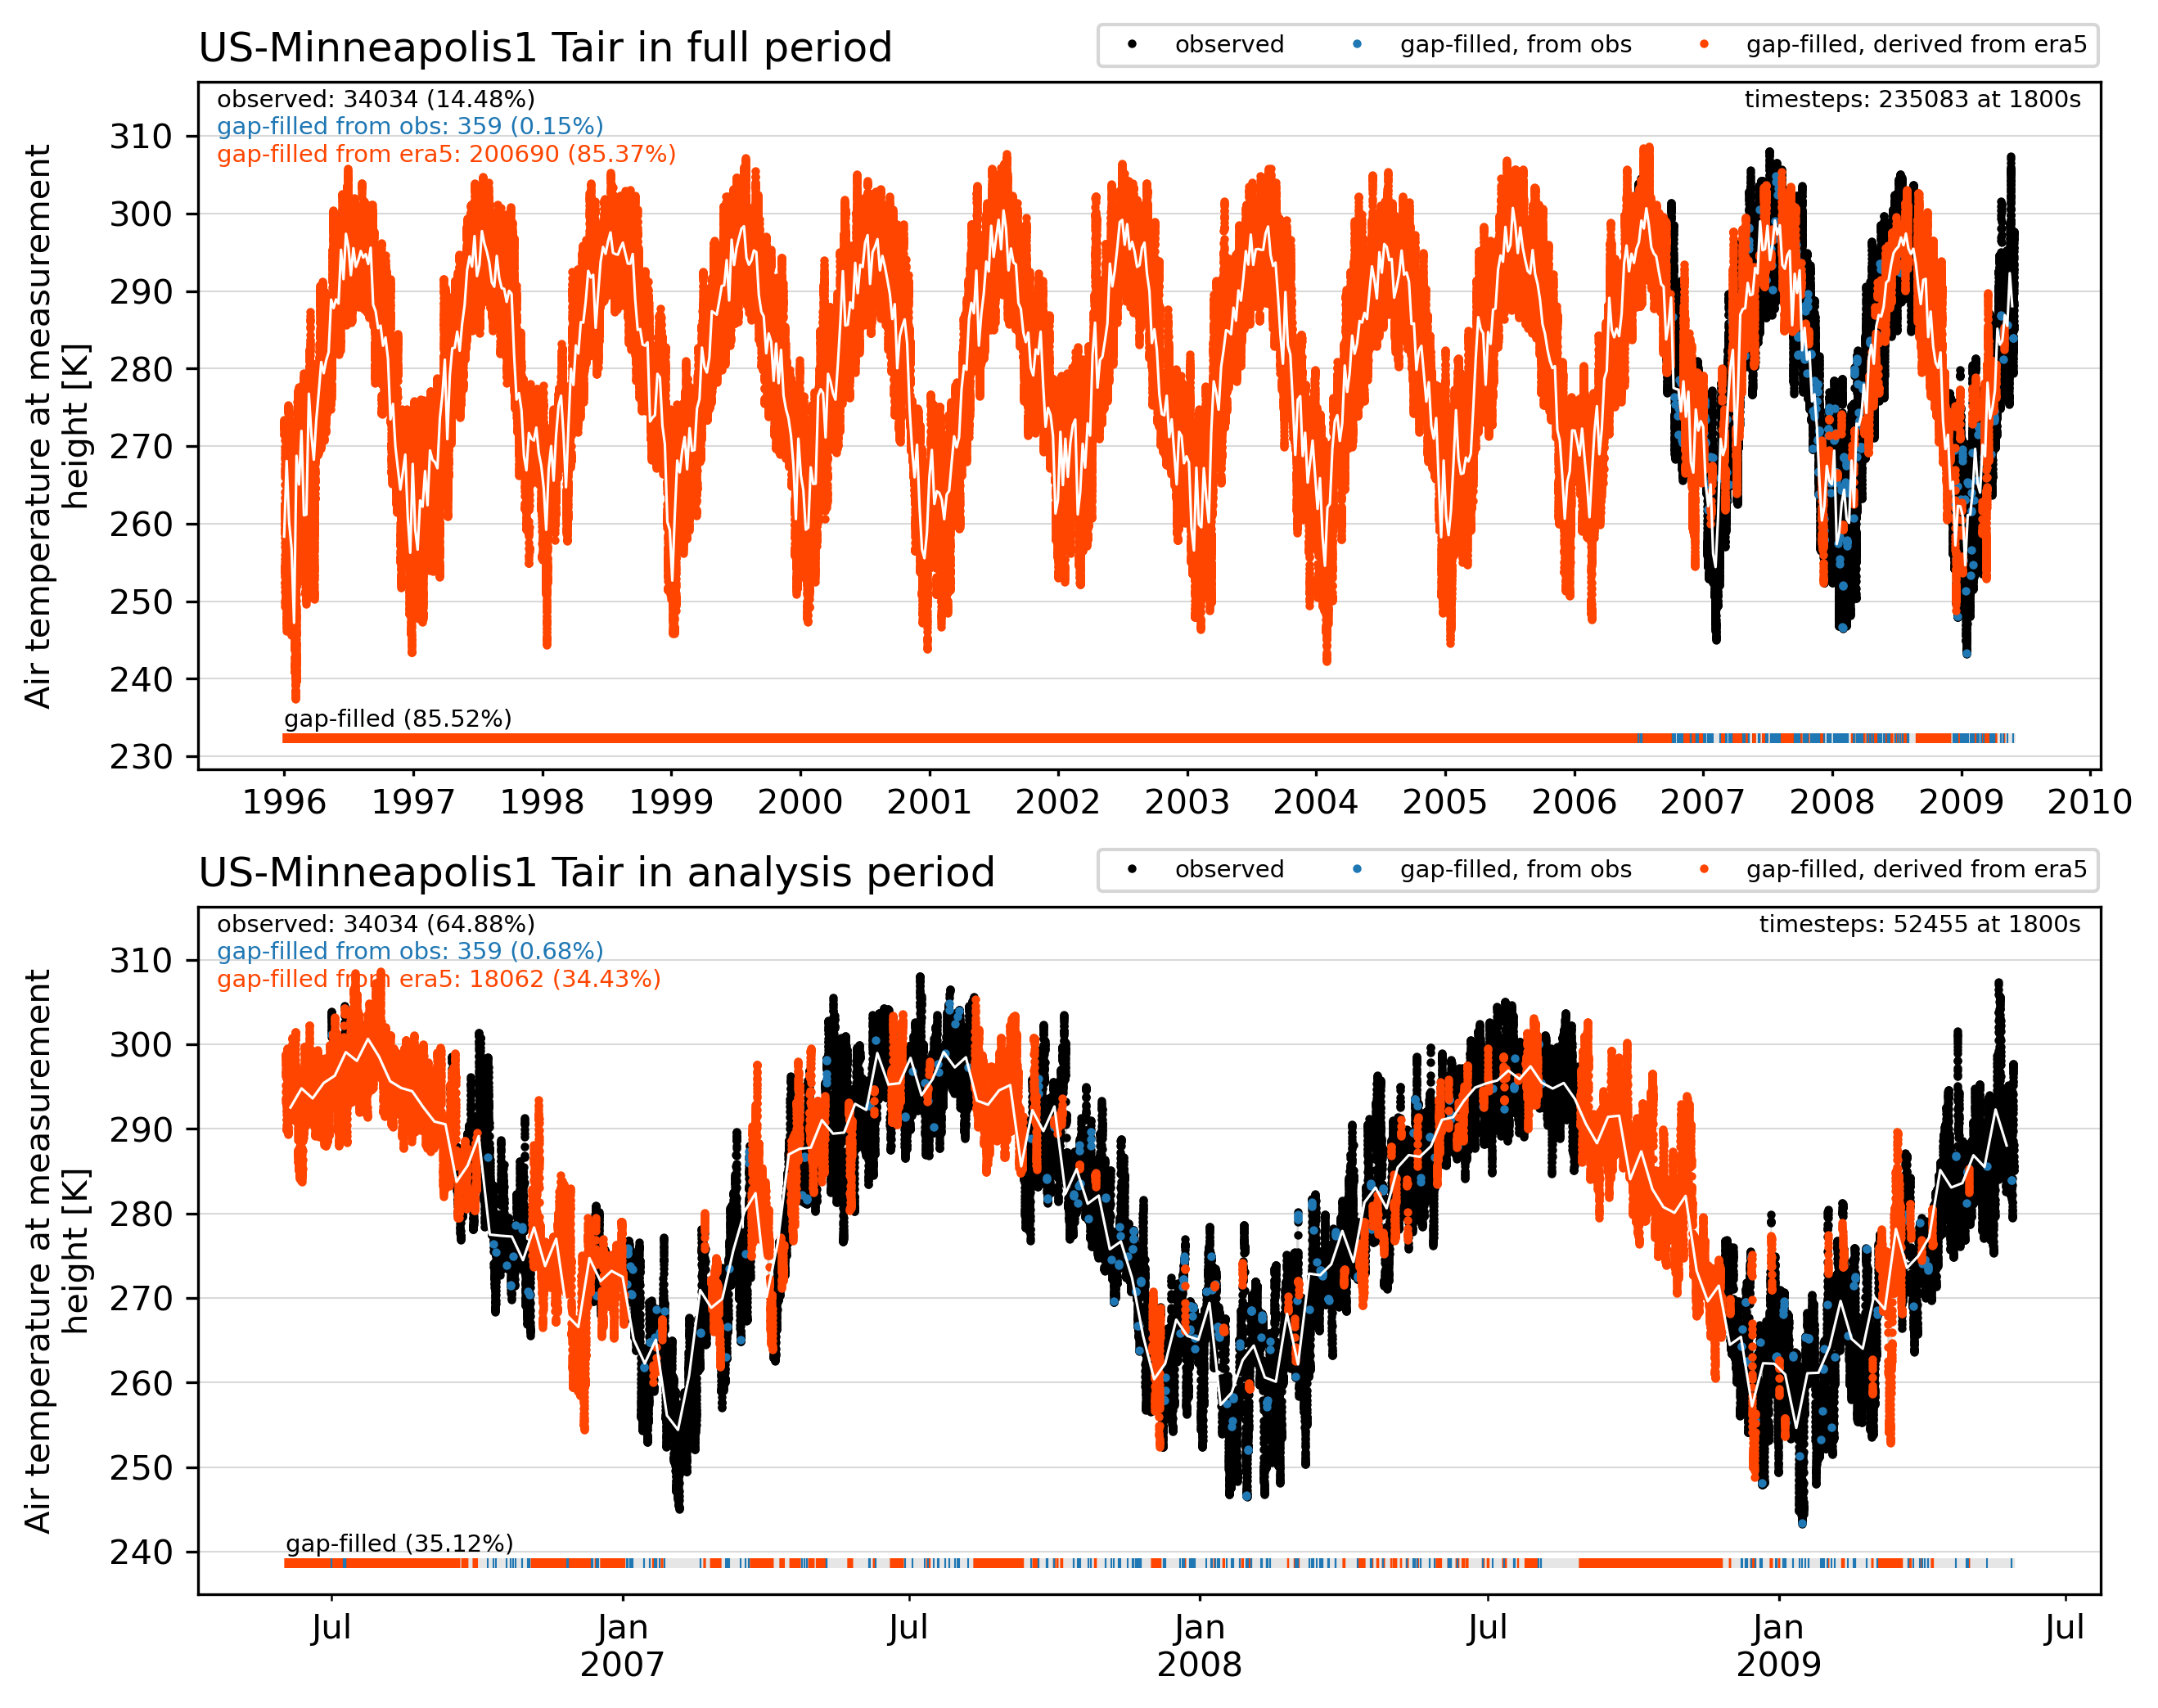
Tair forcing
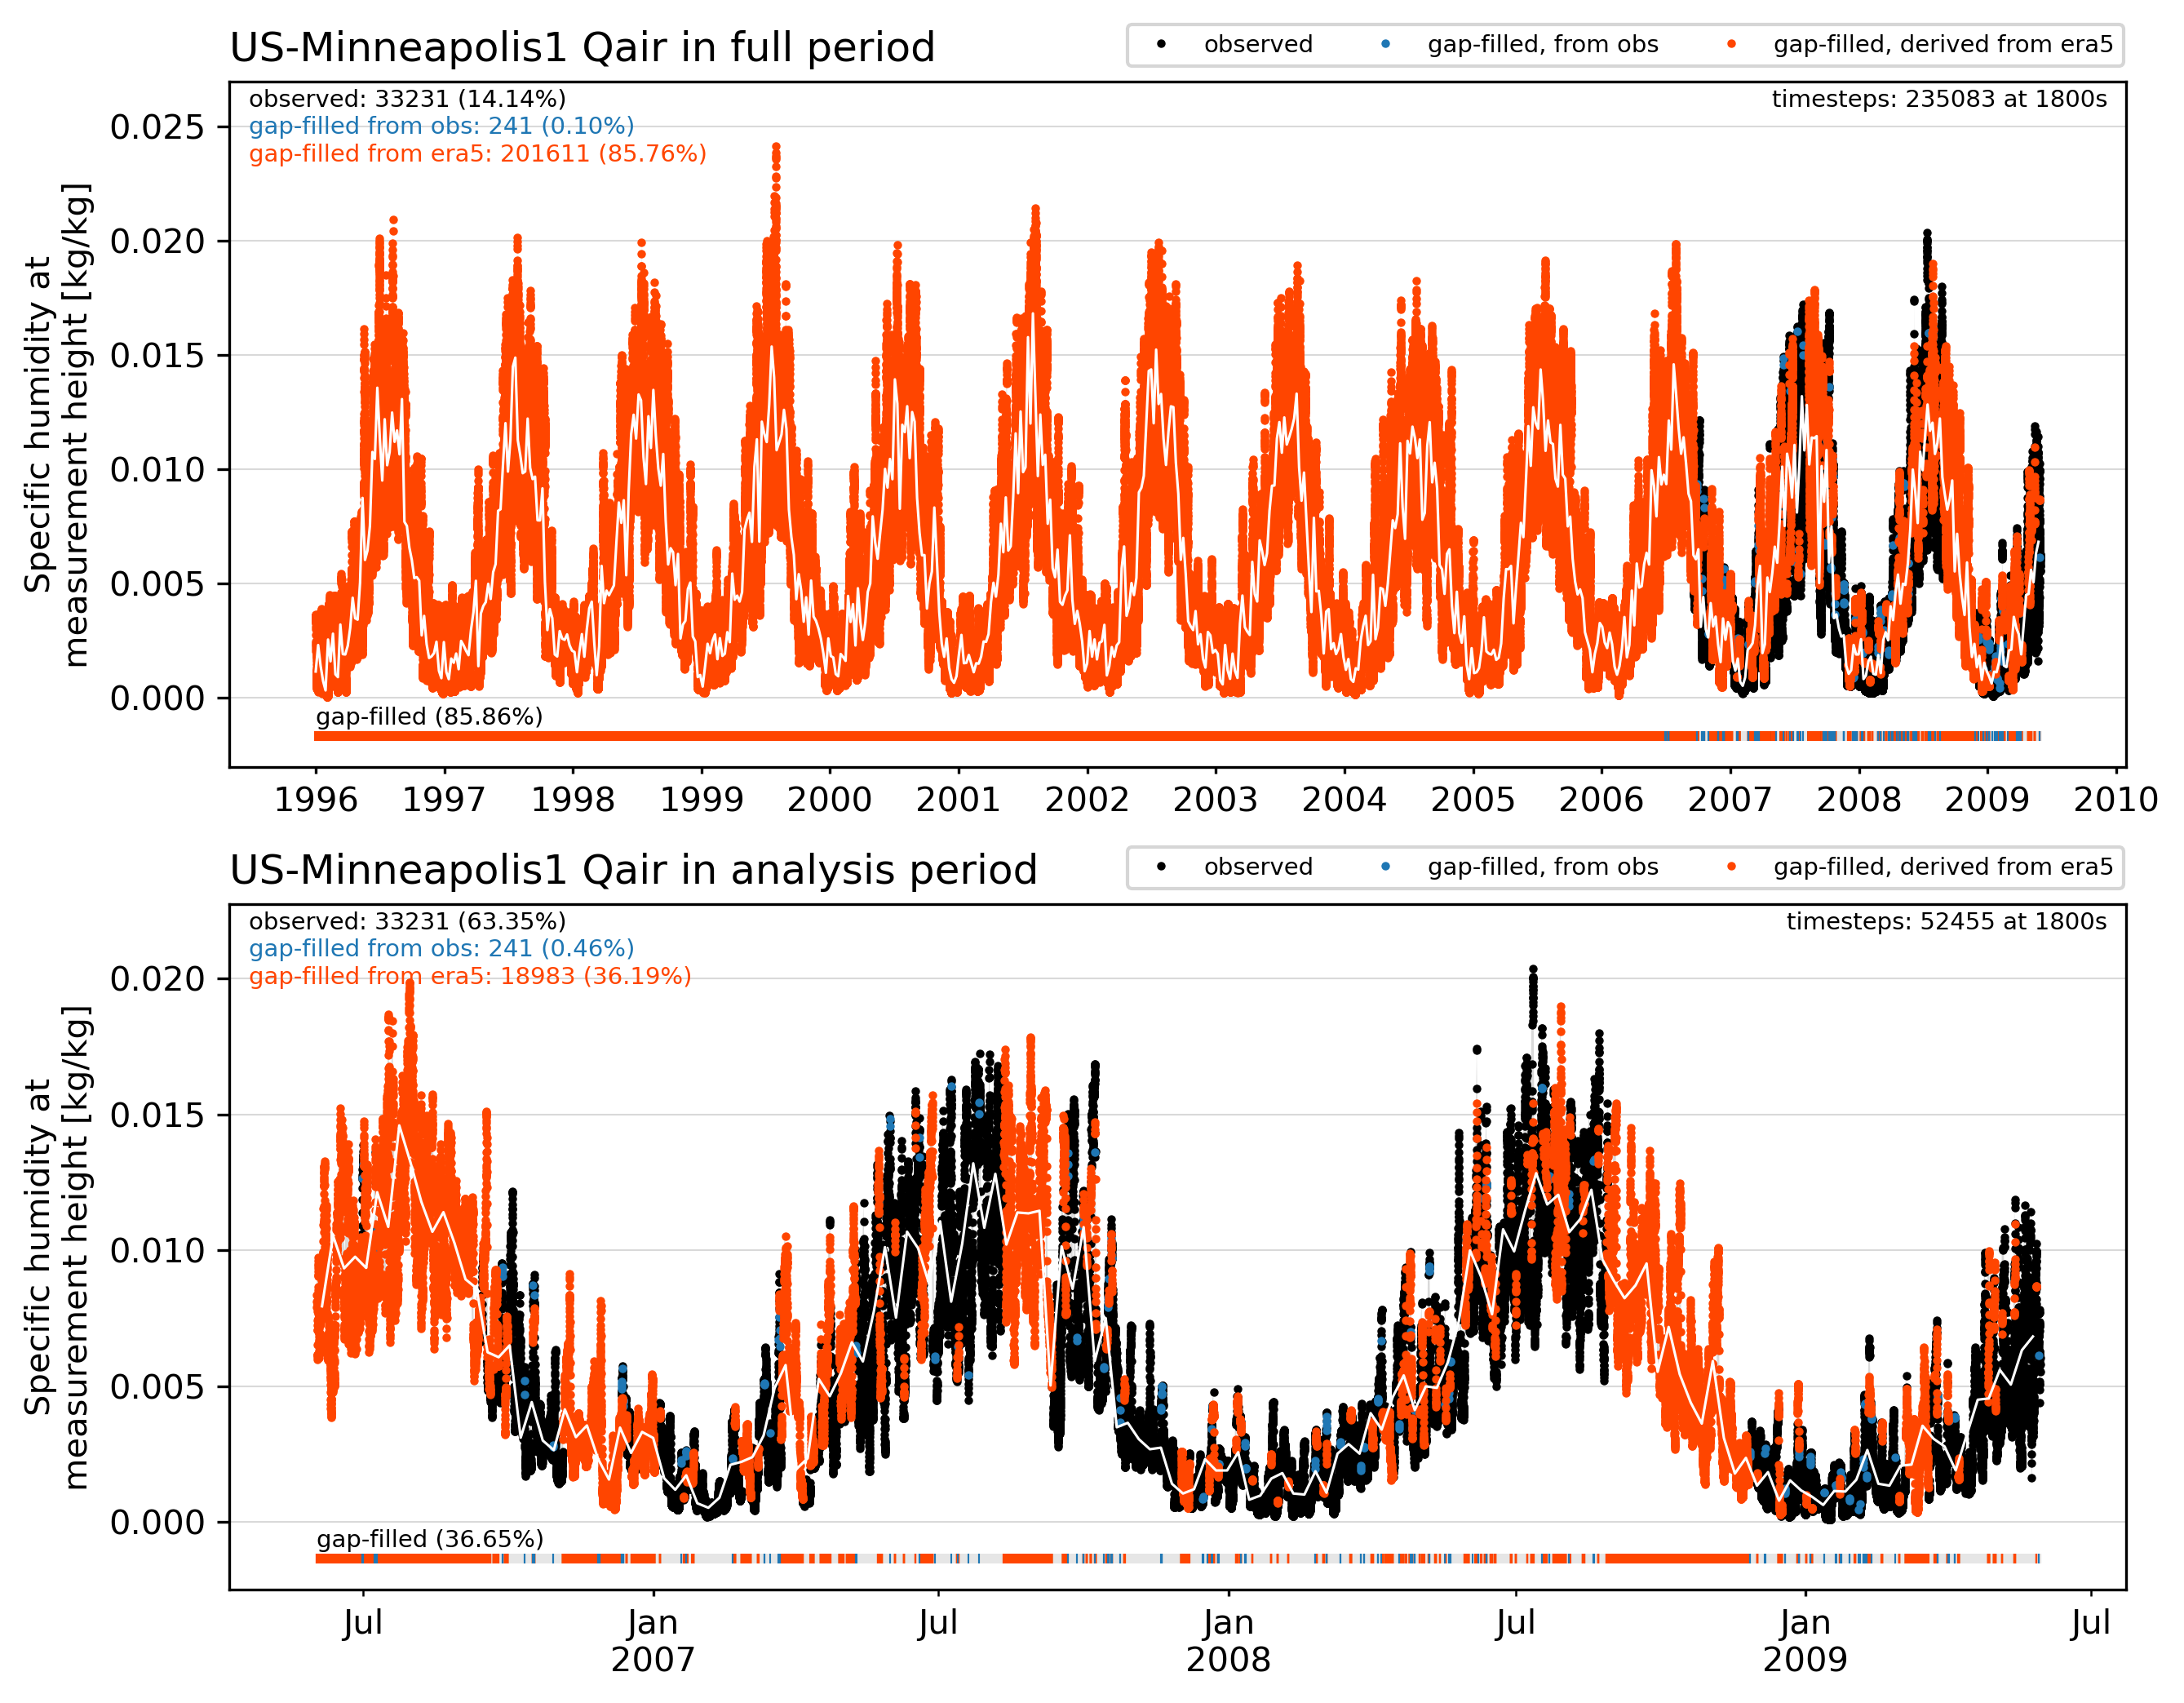
Qair forcing
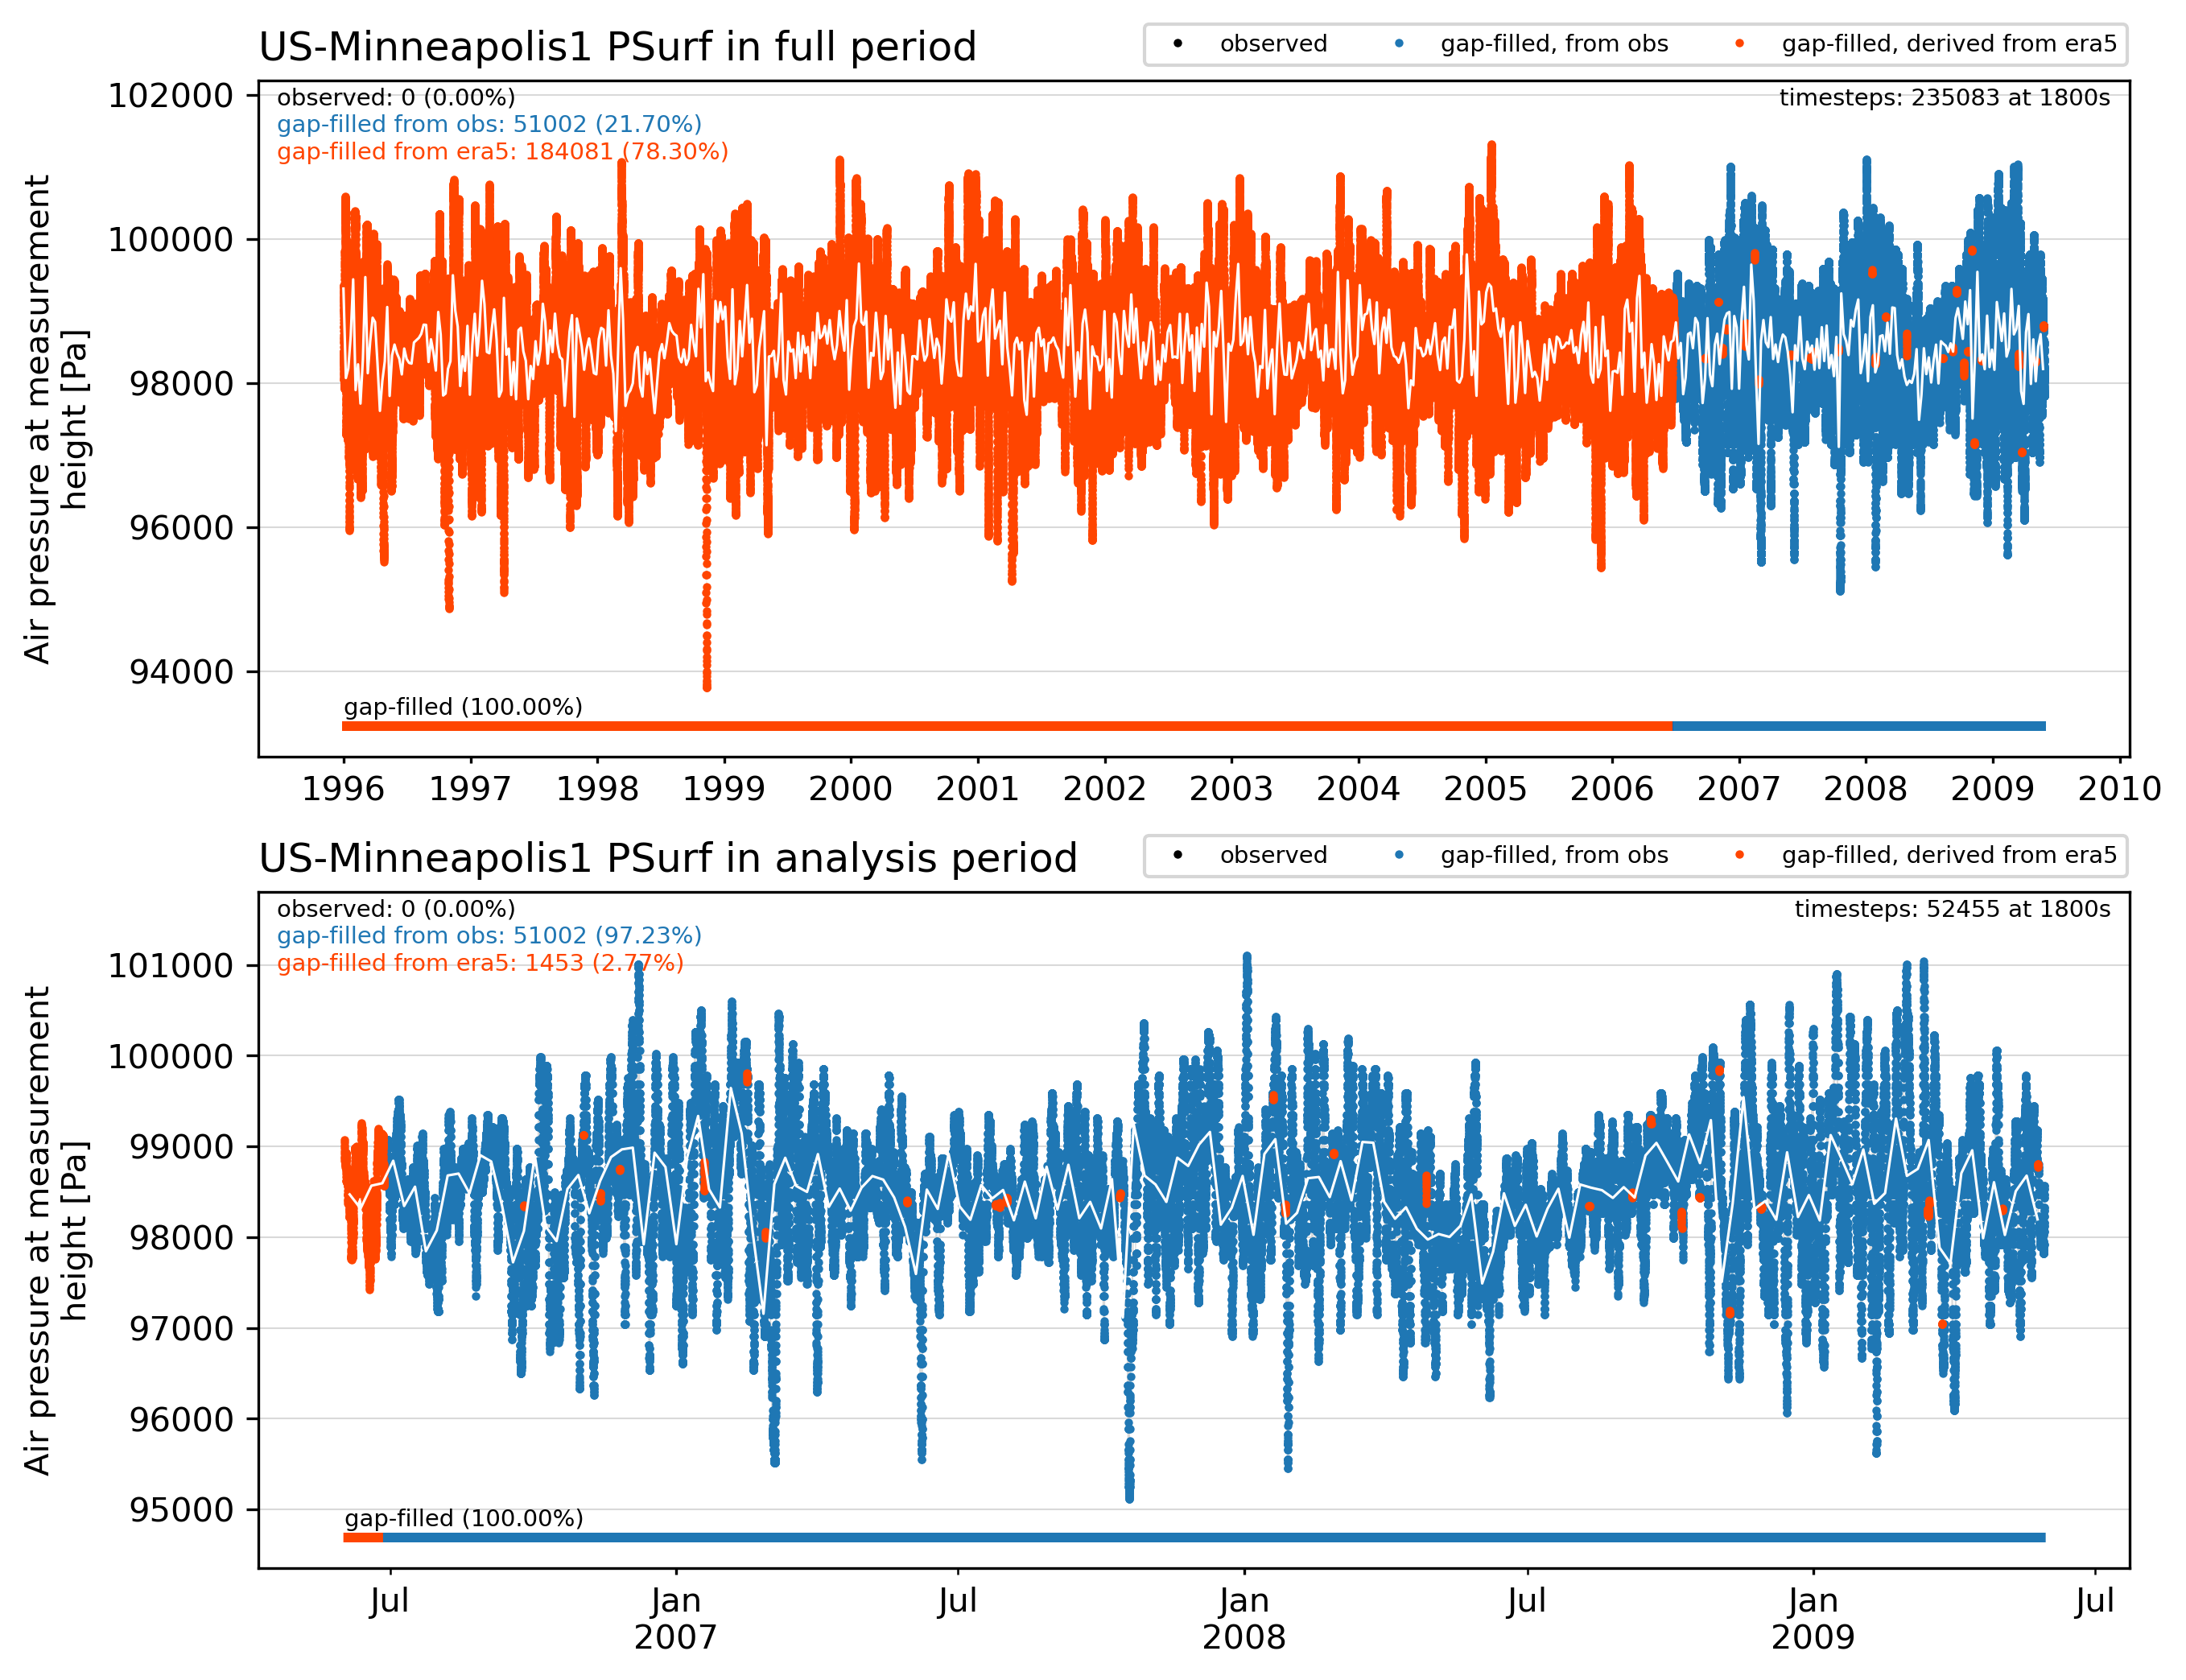
PSurf forcing
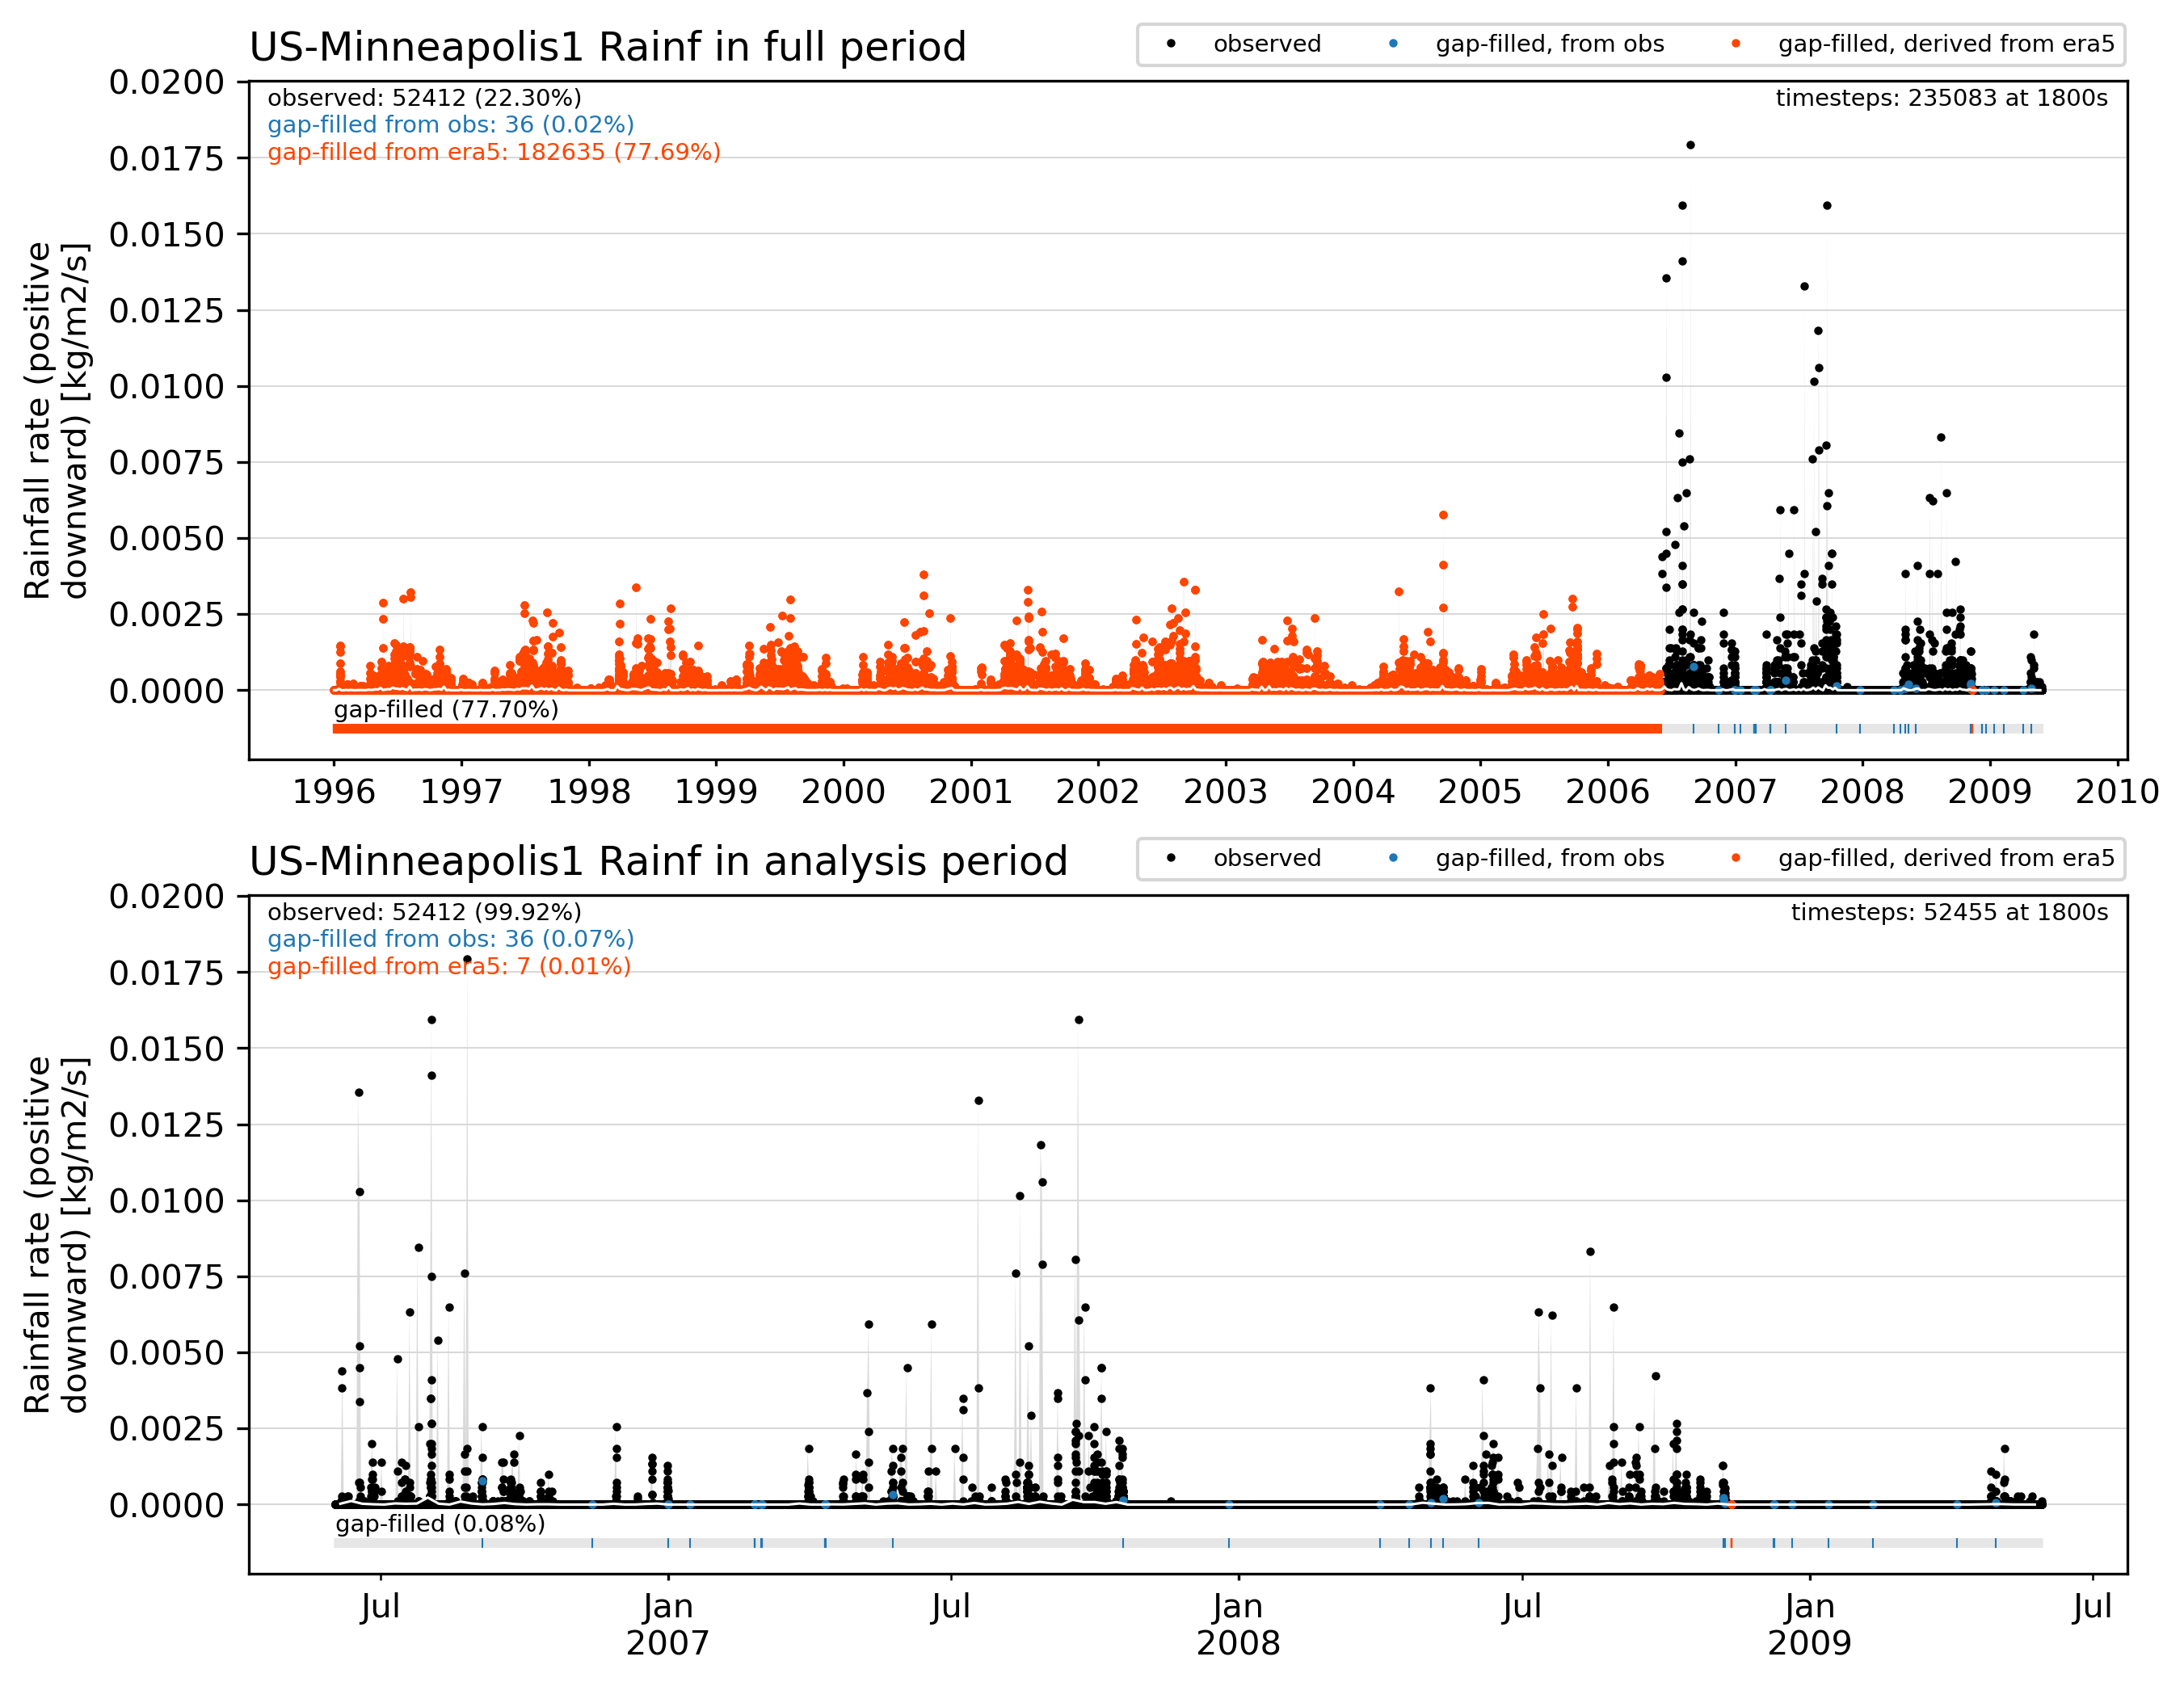
Rainf forcing
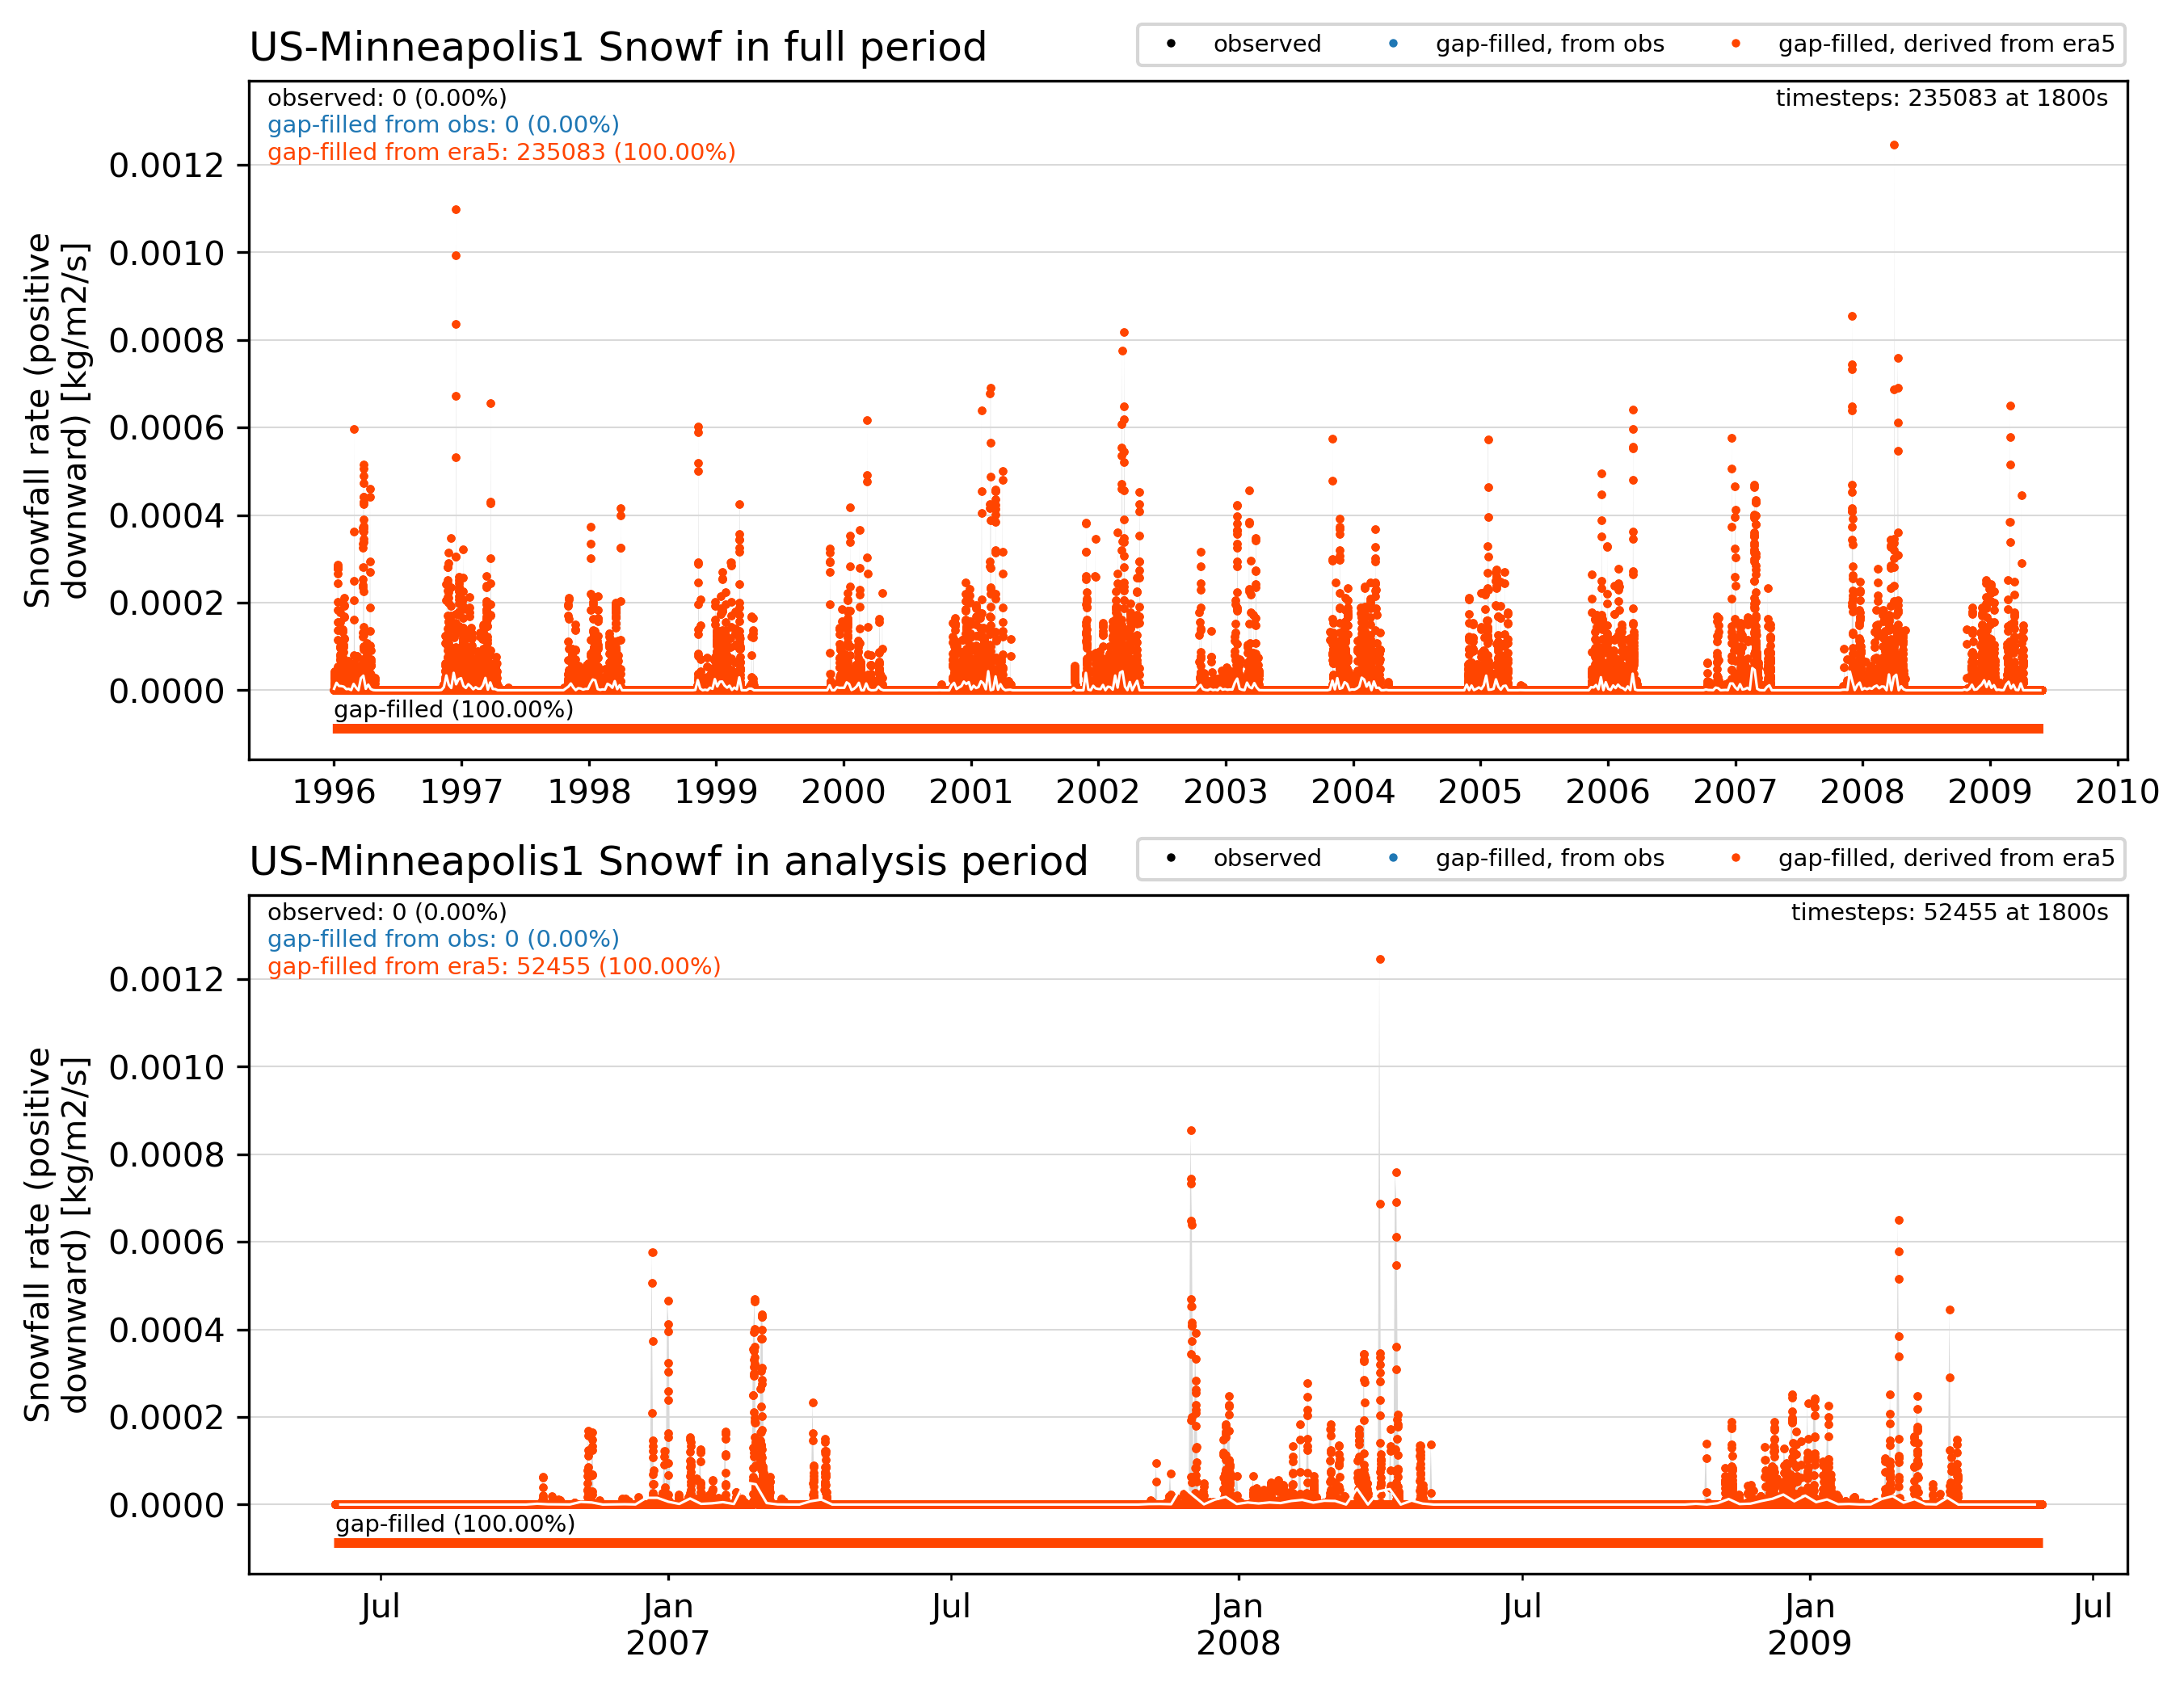
Snowf forcing
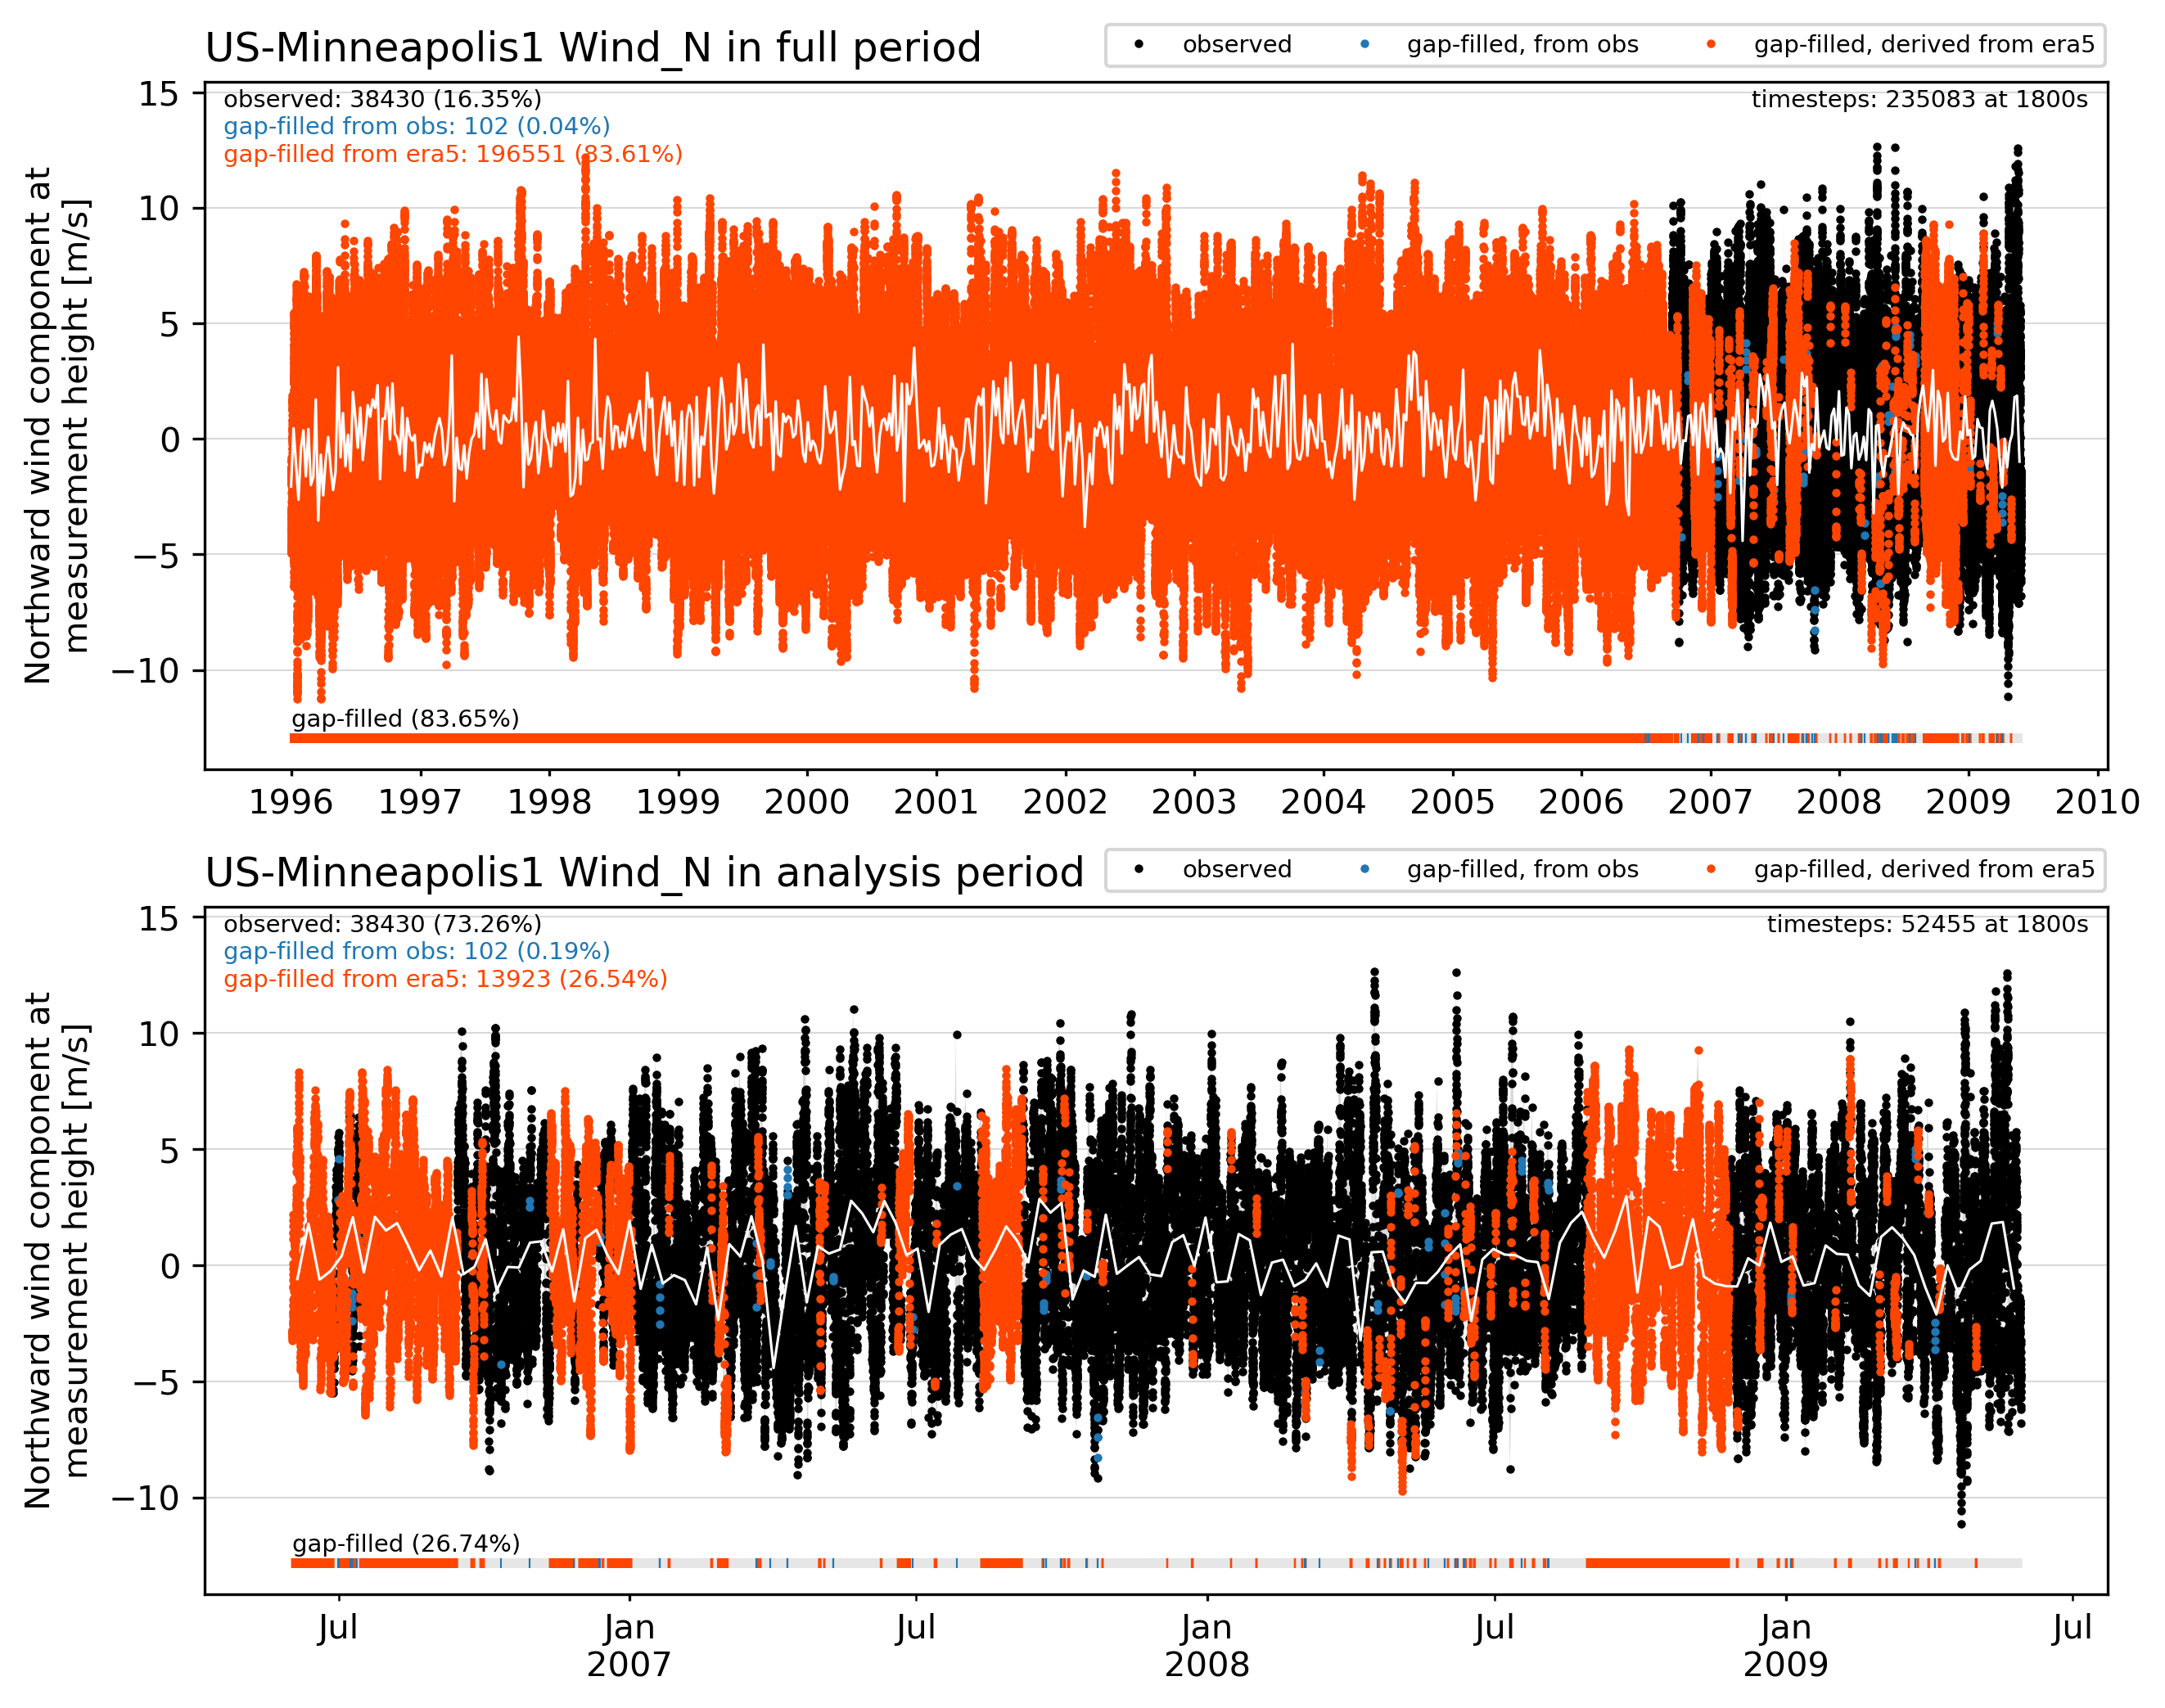
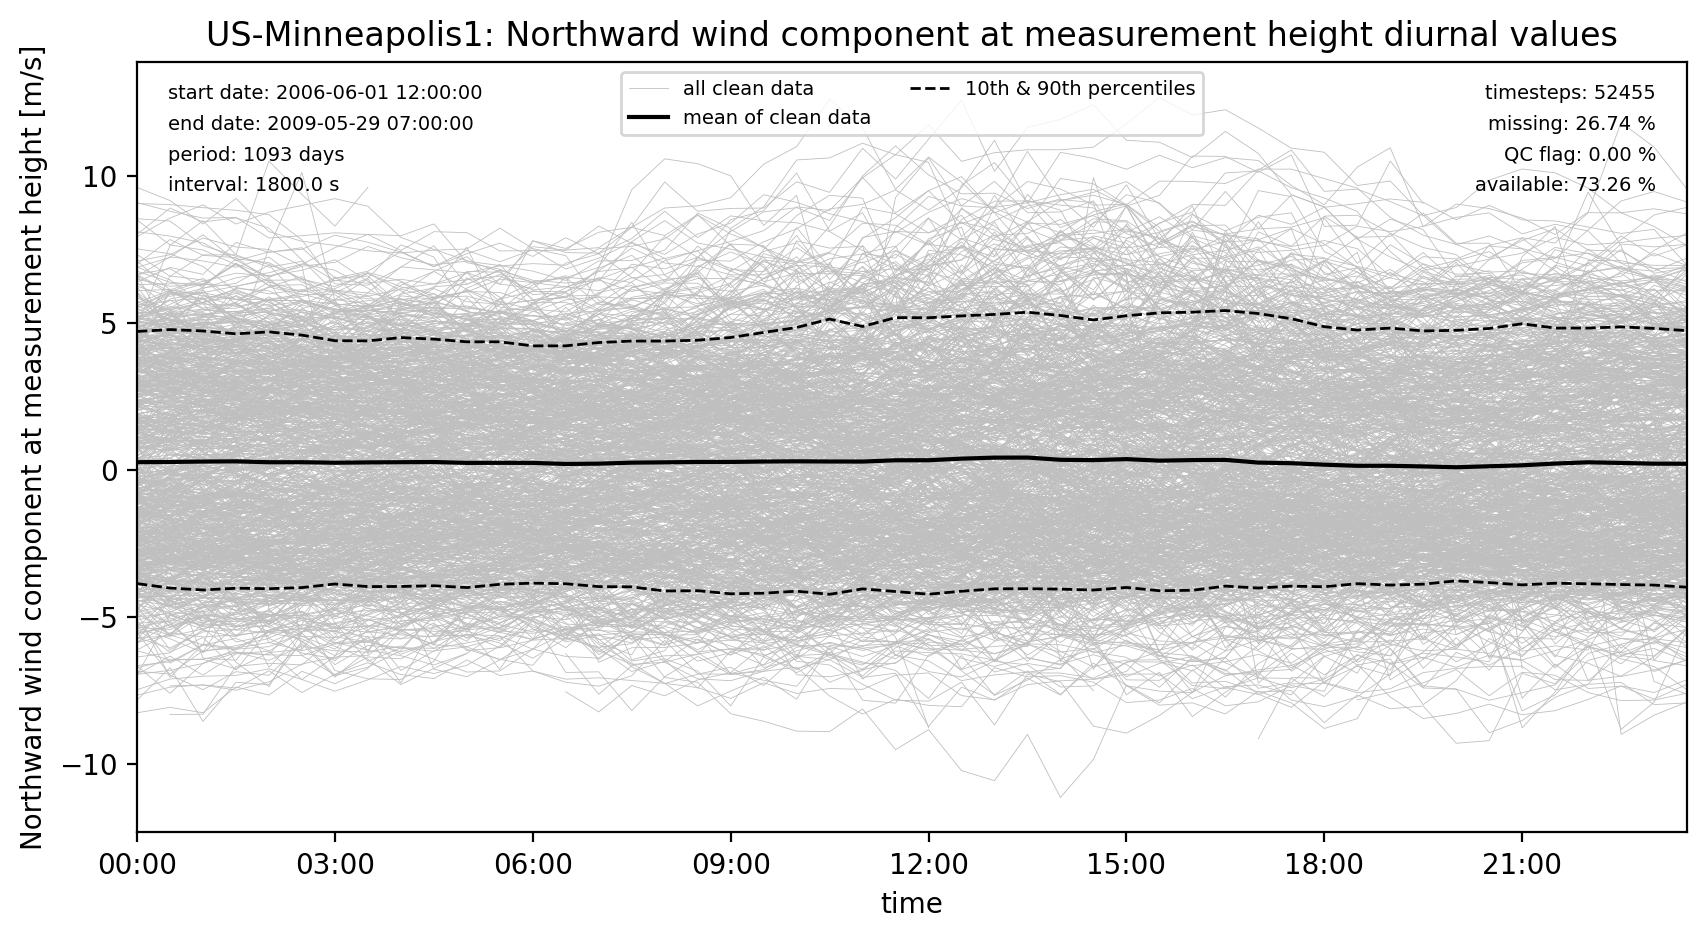
Wind_N forcing
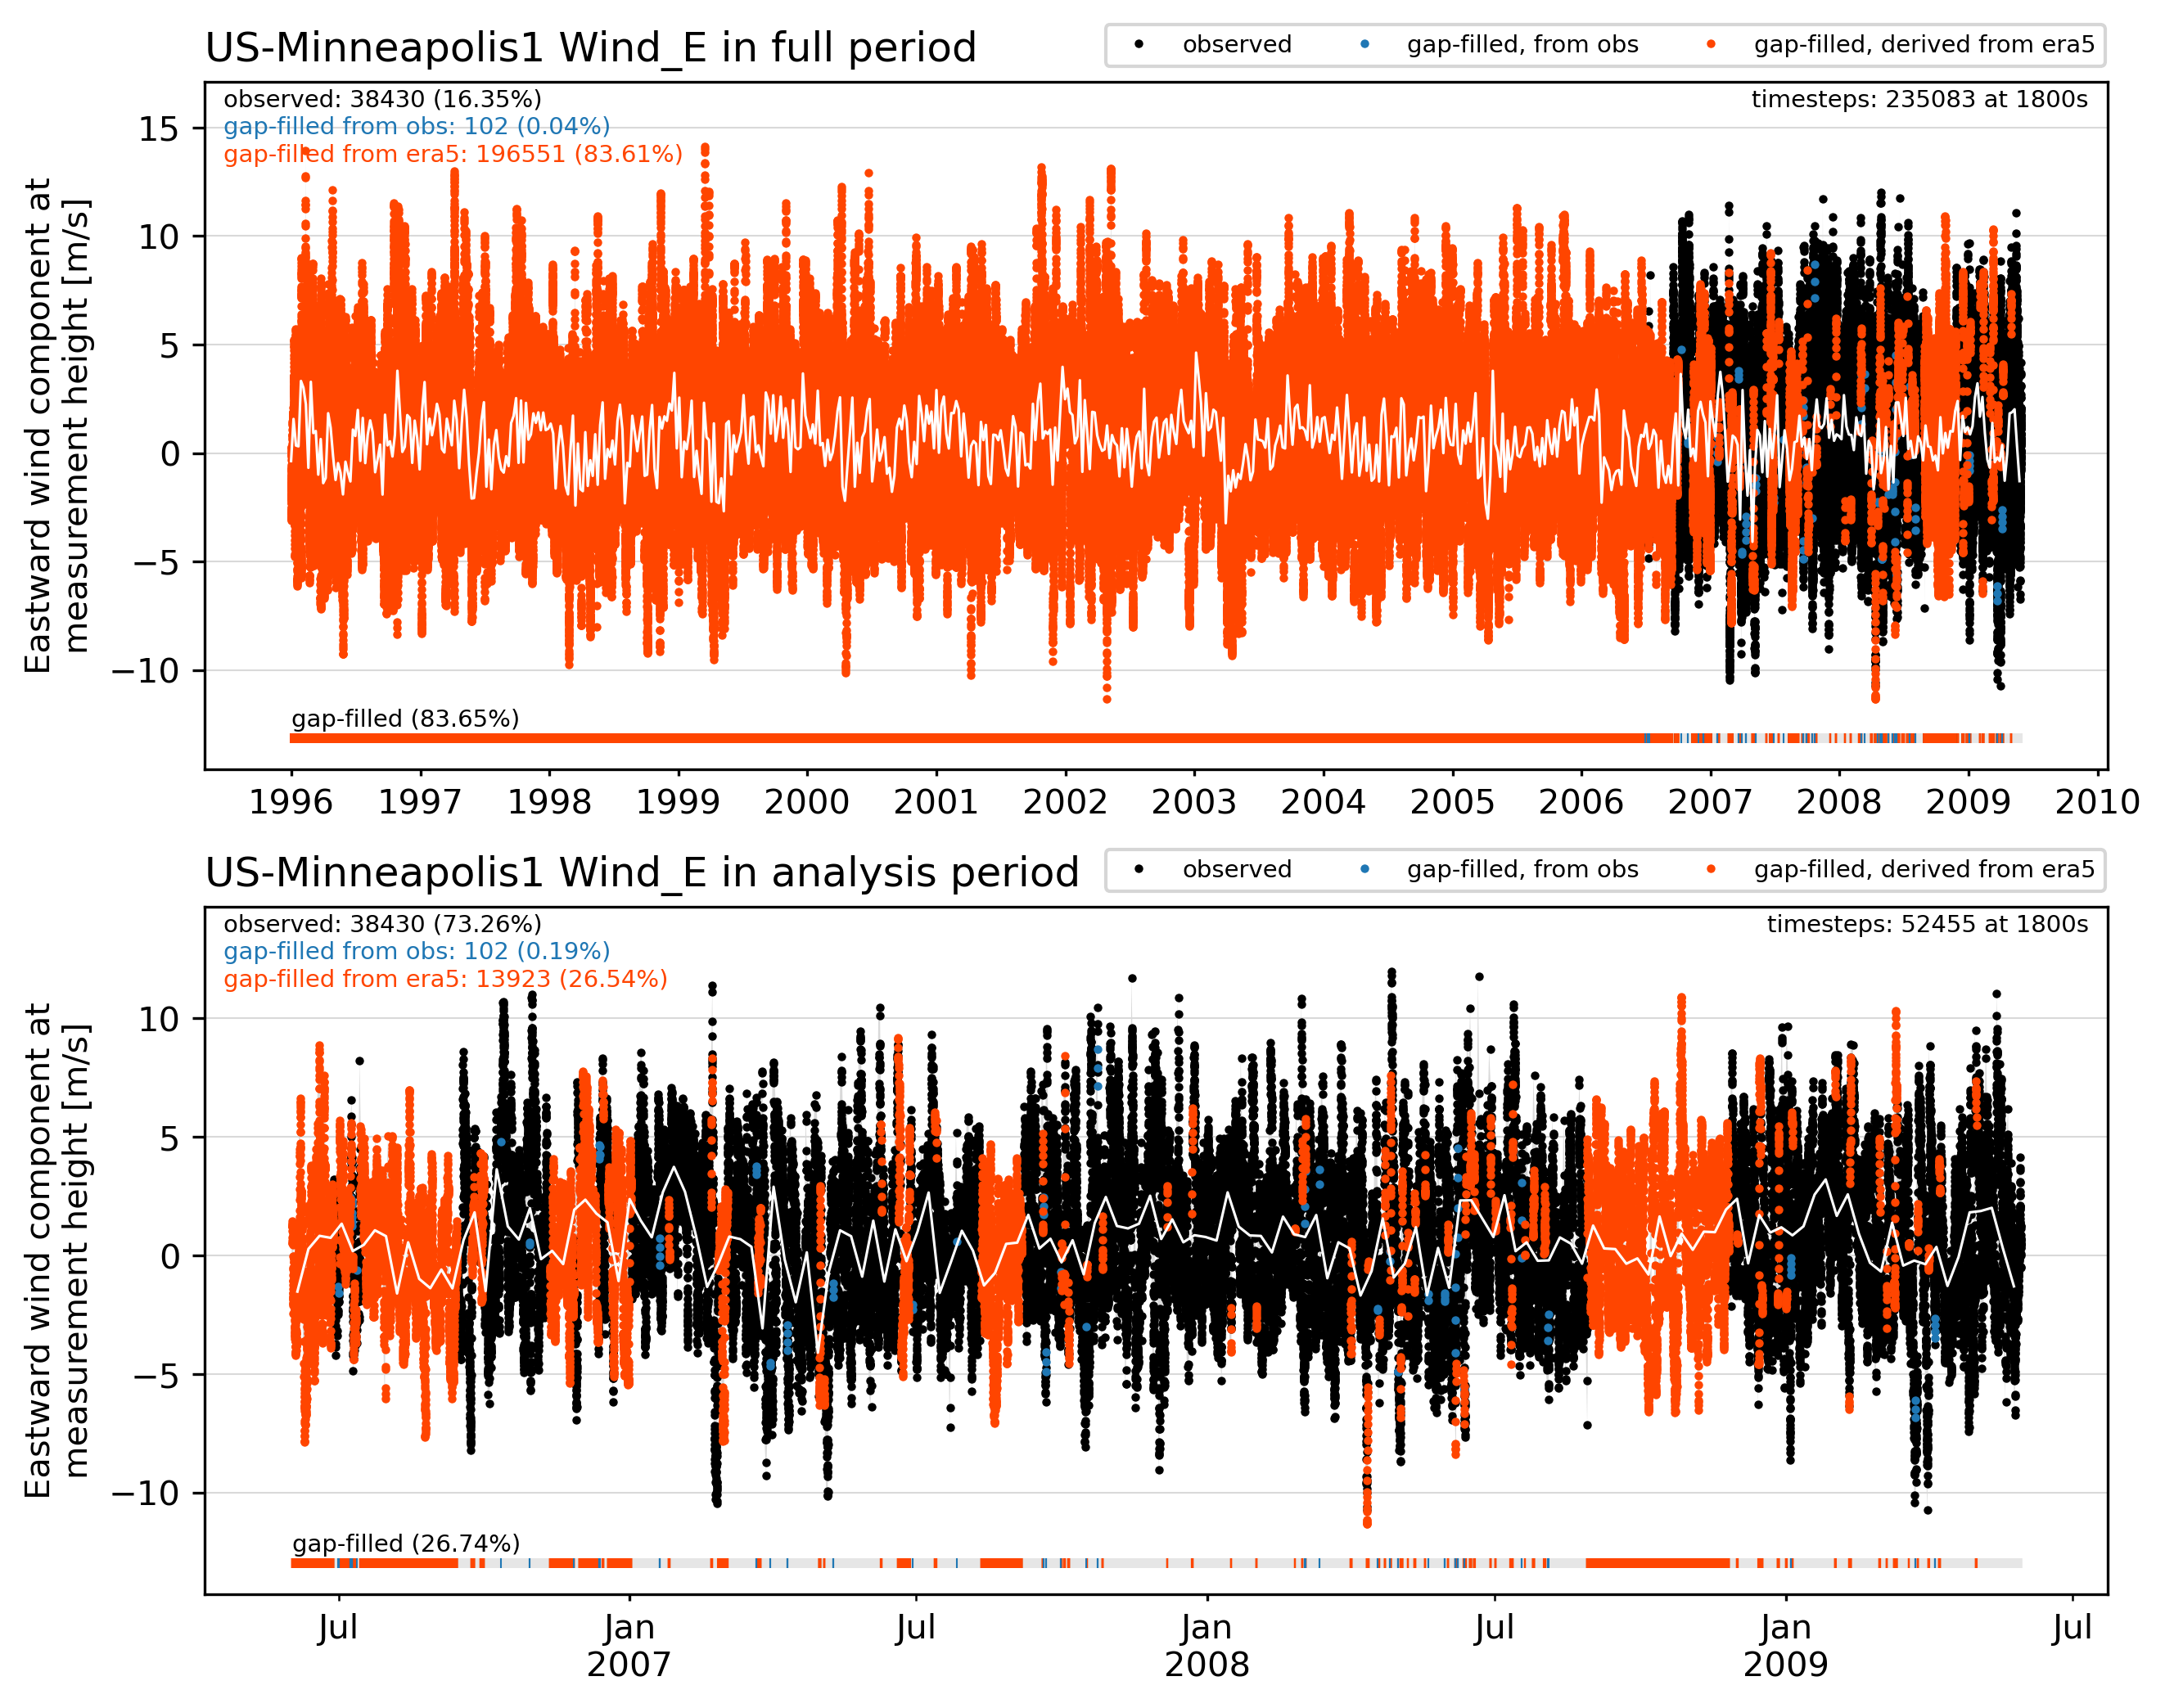
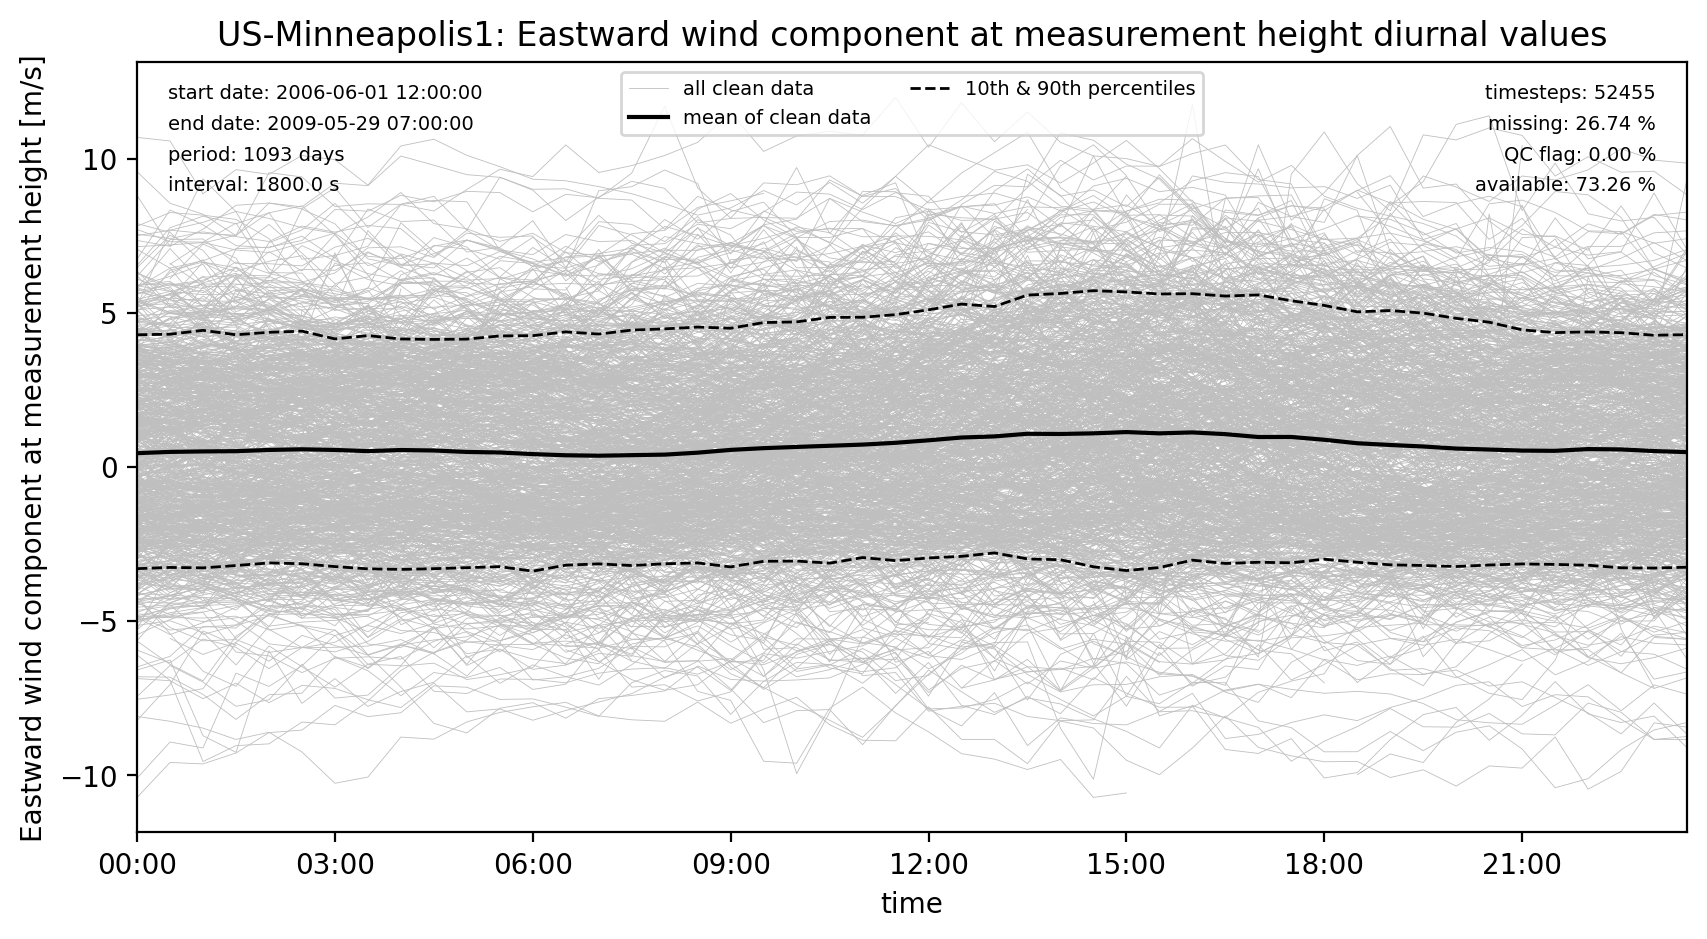
Wind_E forcing
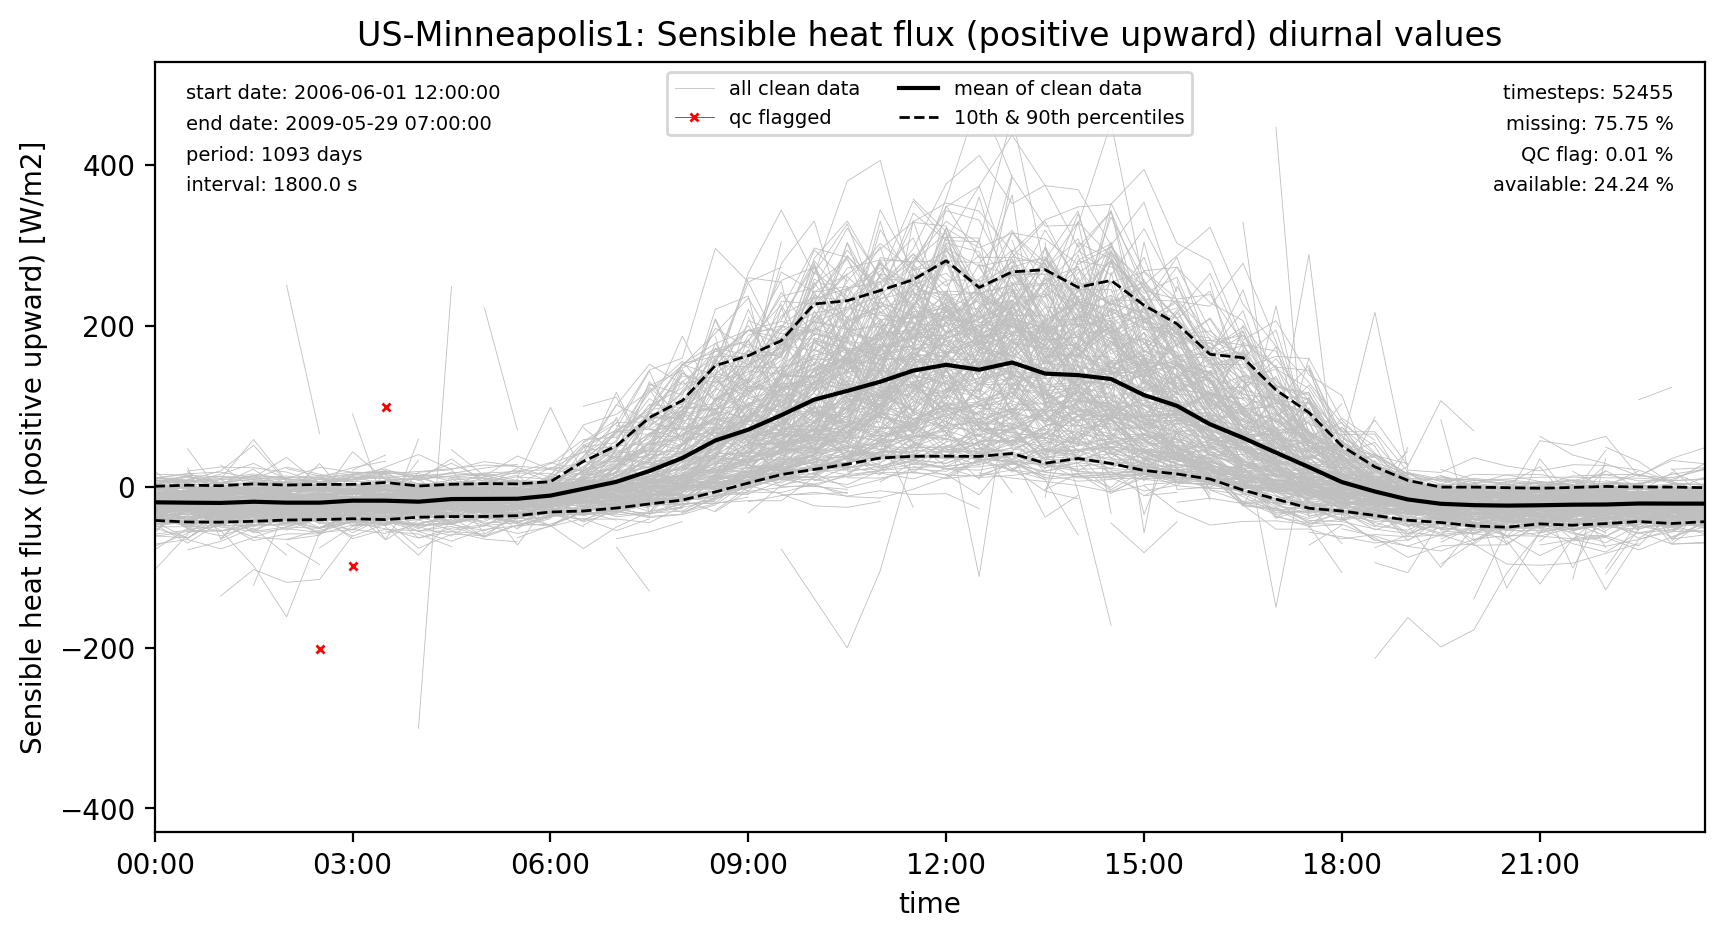
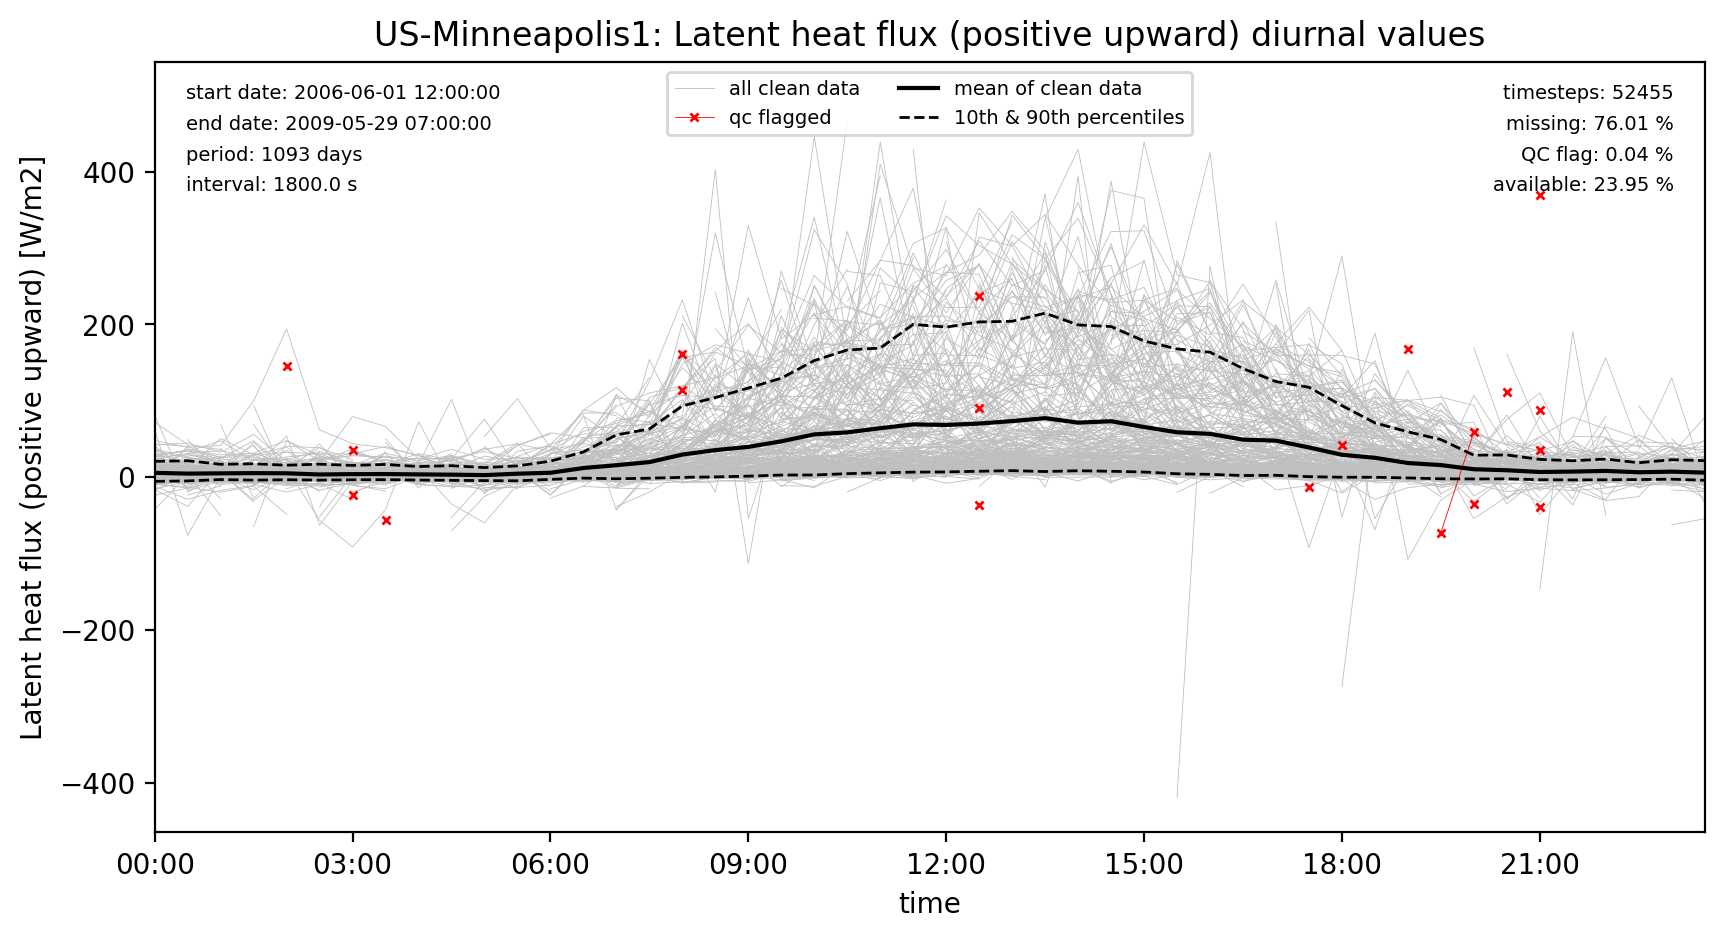
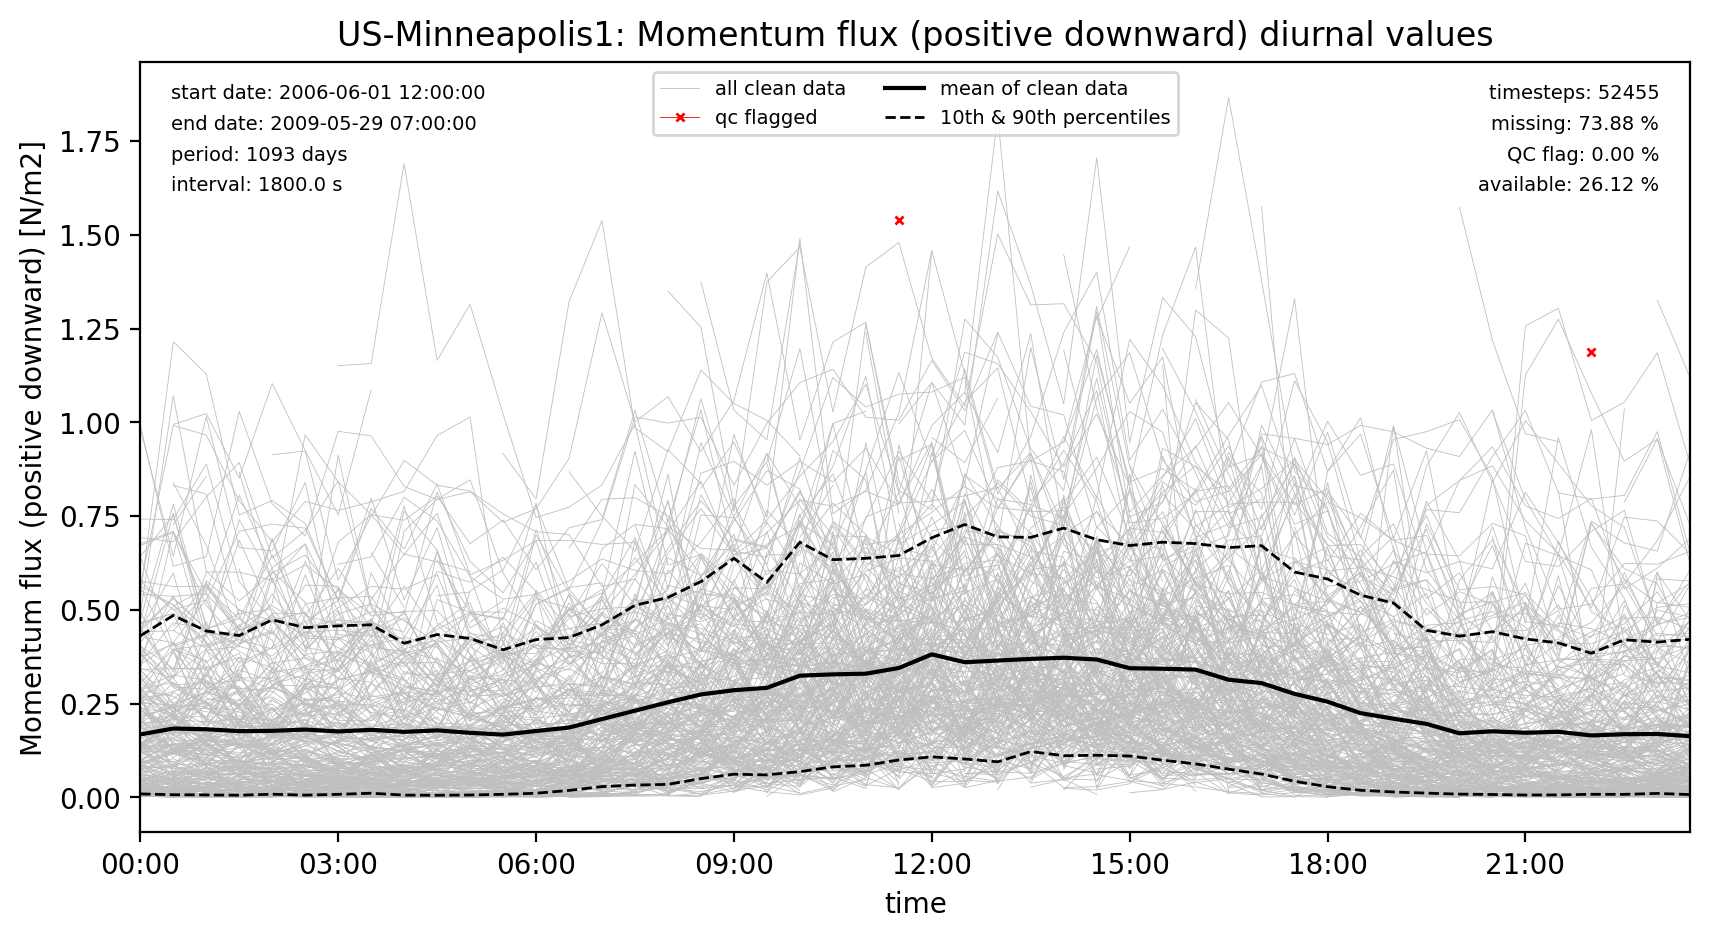
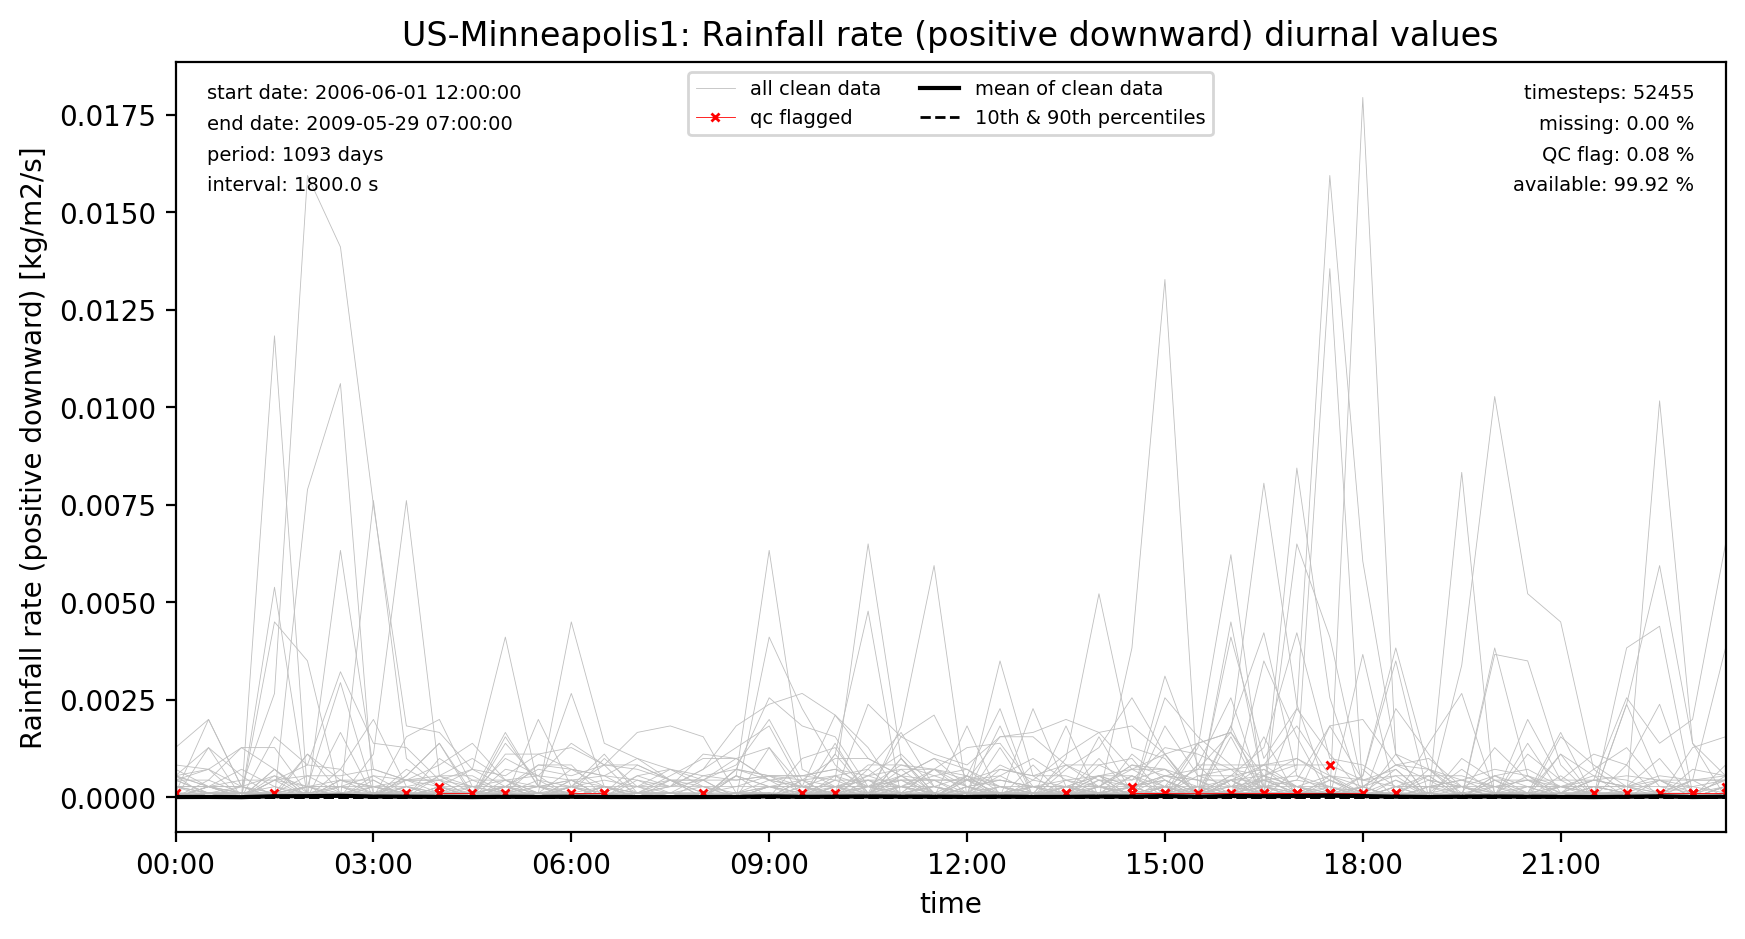
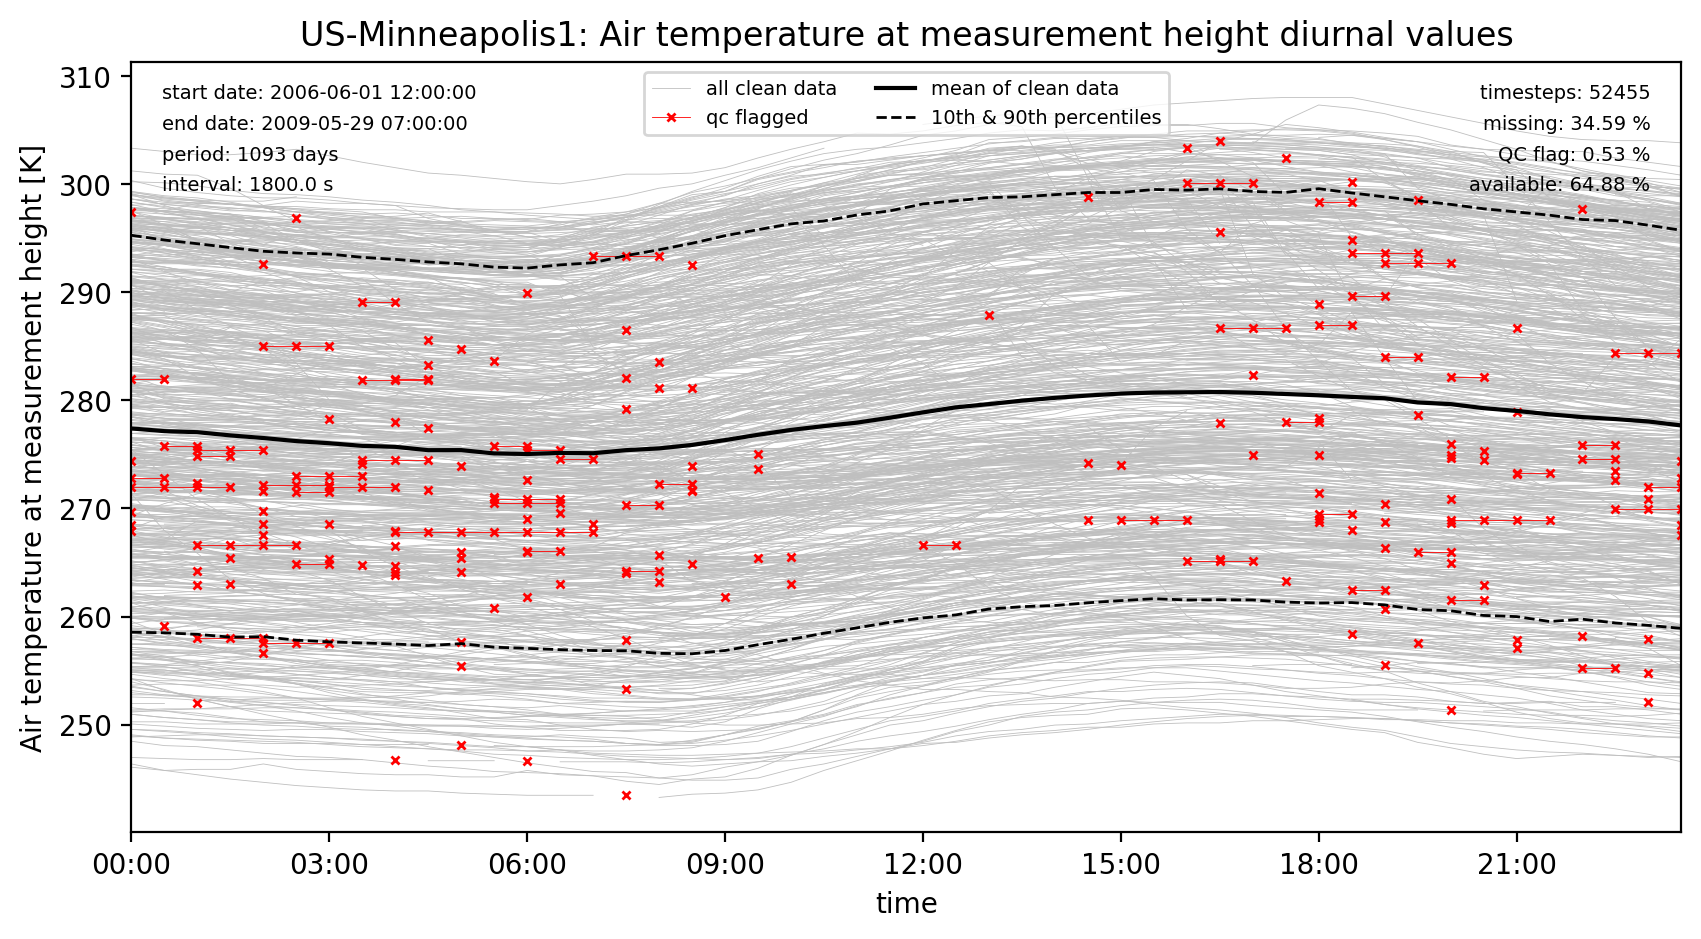
Quality control (qc) and gap filling procedure
QC process on observations
- Out-of-range: removal of unphysical values (e.g. negative shortwave radiation) using the ALMA expected range protocol.
- Night: nocturnal shortwave radiation set to zero, excluding civil twilight (when the sun is 6° below the horizon).
- Constant: four or more timesteps with the same value (excluding zero values for shortwave radiation, rainfall and snowfall) are removed as suspicious.
- Outlier: remove values outside ±4 standard deviations for each hour in a rolling 30-day window (to account for diurnal and seasonal variations). Repeat with a larger tolerance (± 5 standard deviations) until no outliers remain. The outlier test is not applied to precipitation.
- Visual: remaining suspect readings are removed manually via visual inspection.
Gap-filling process
- contemporaneous and nearby flux tower or weather observing sites (where available and provided by observing groups)
- small gaps (≤ 2 hours) are linearly interpolated from the adjoining observations
- larger gaps (and a 10-year spin-up period) are filled with bias corrected ERA5 data (see below)
- snowfall from ERA5, with water equivalent removed from rainfall to retain mass balance
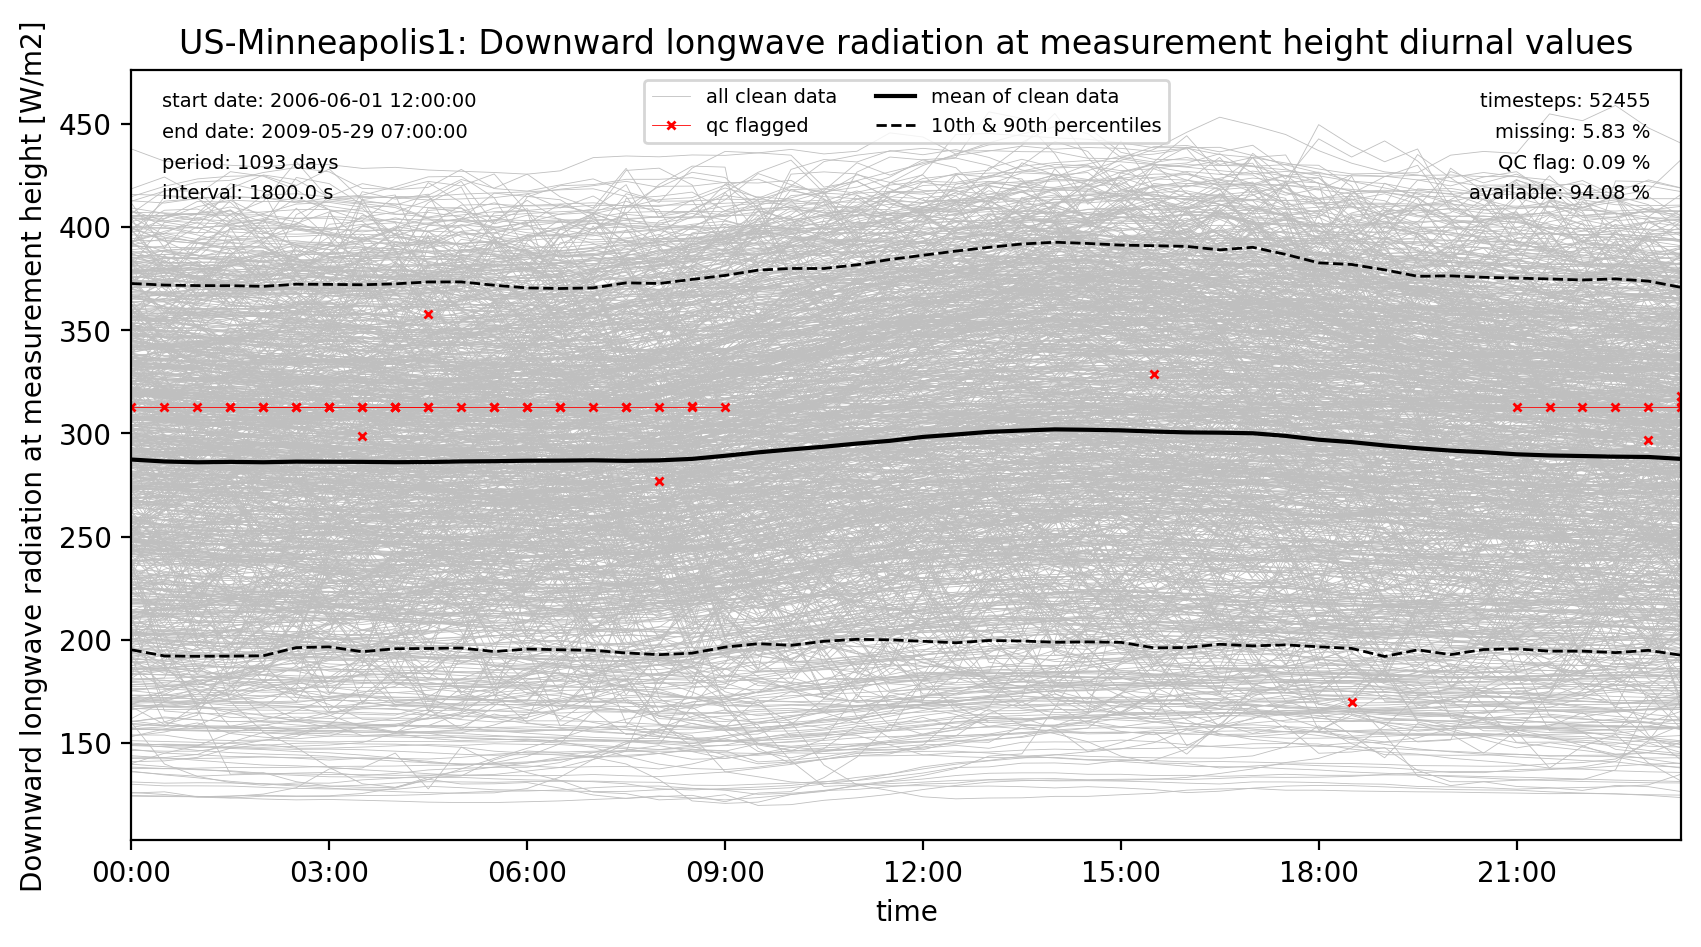
LWdown diurnal qc
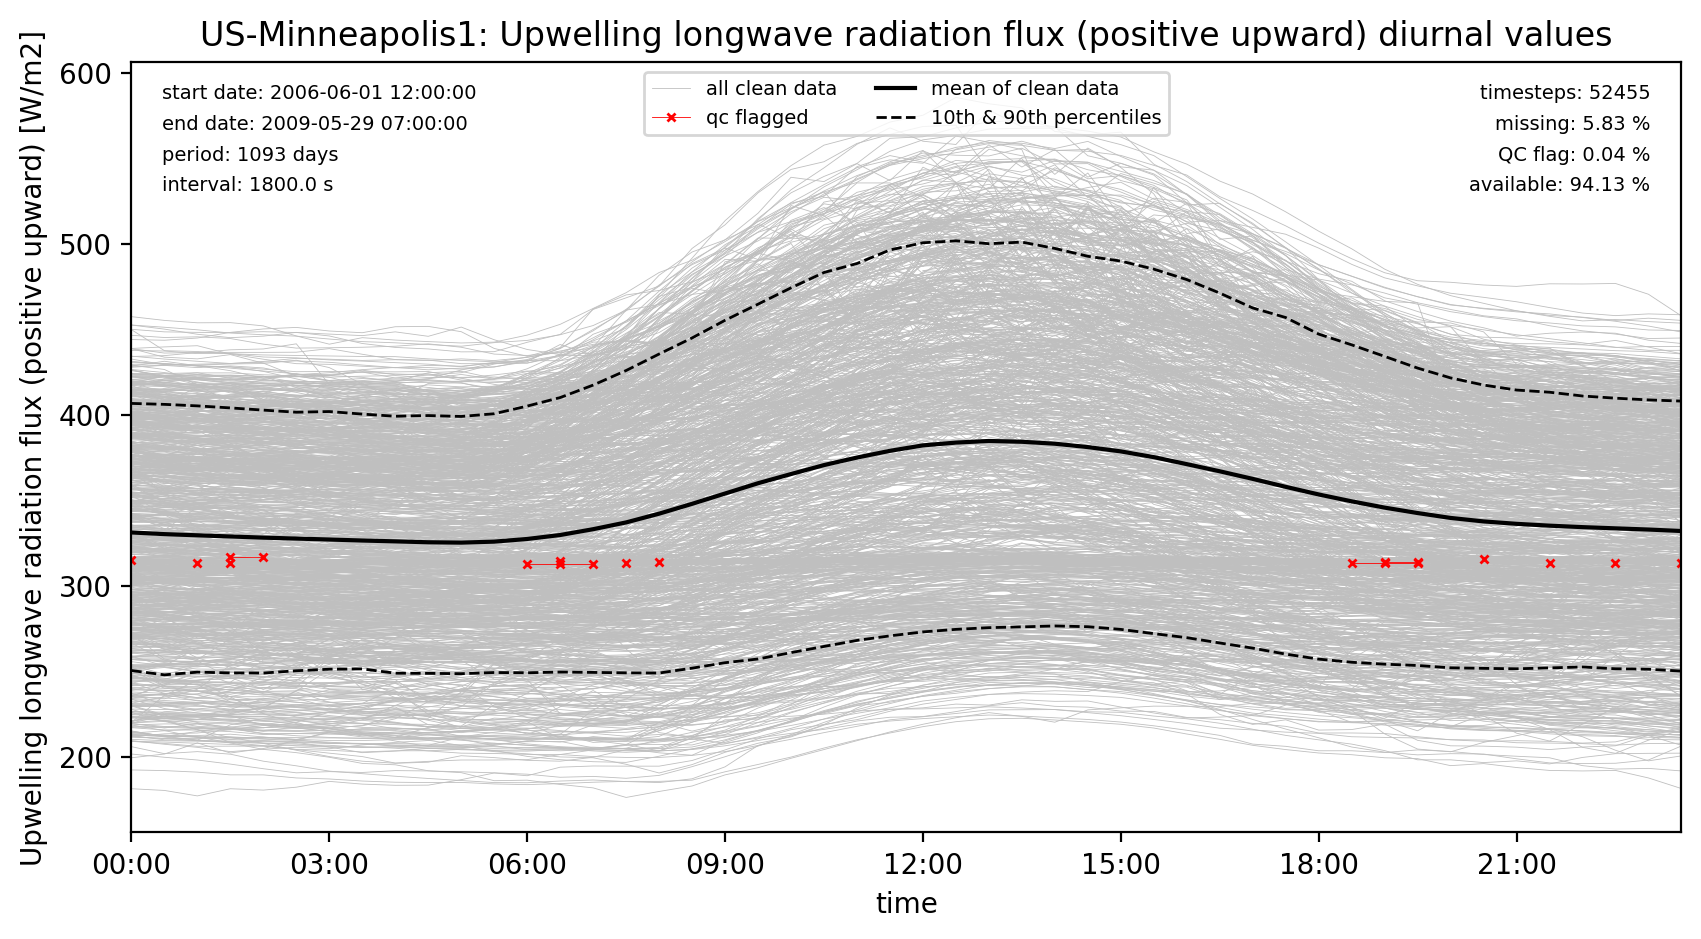
LWup diurnal qc
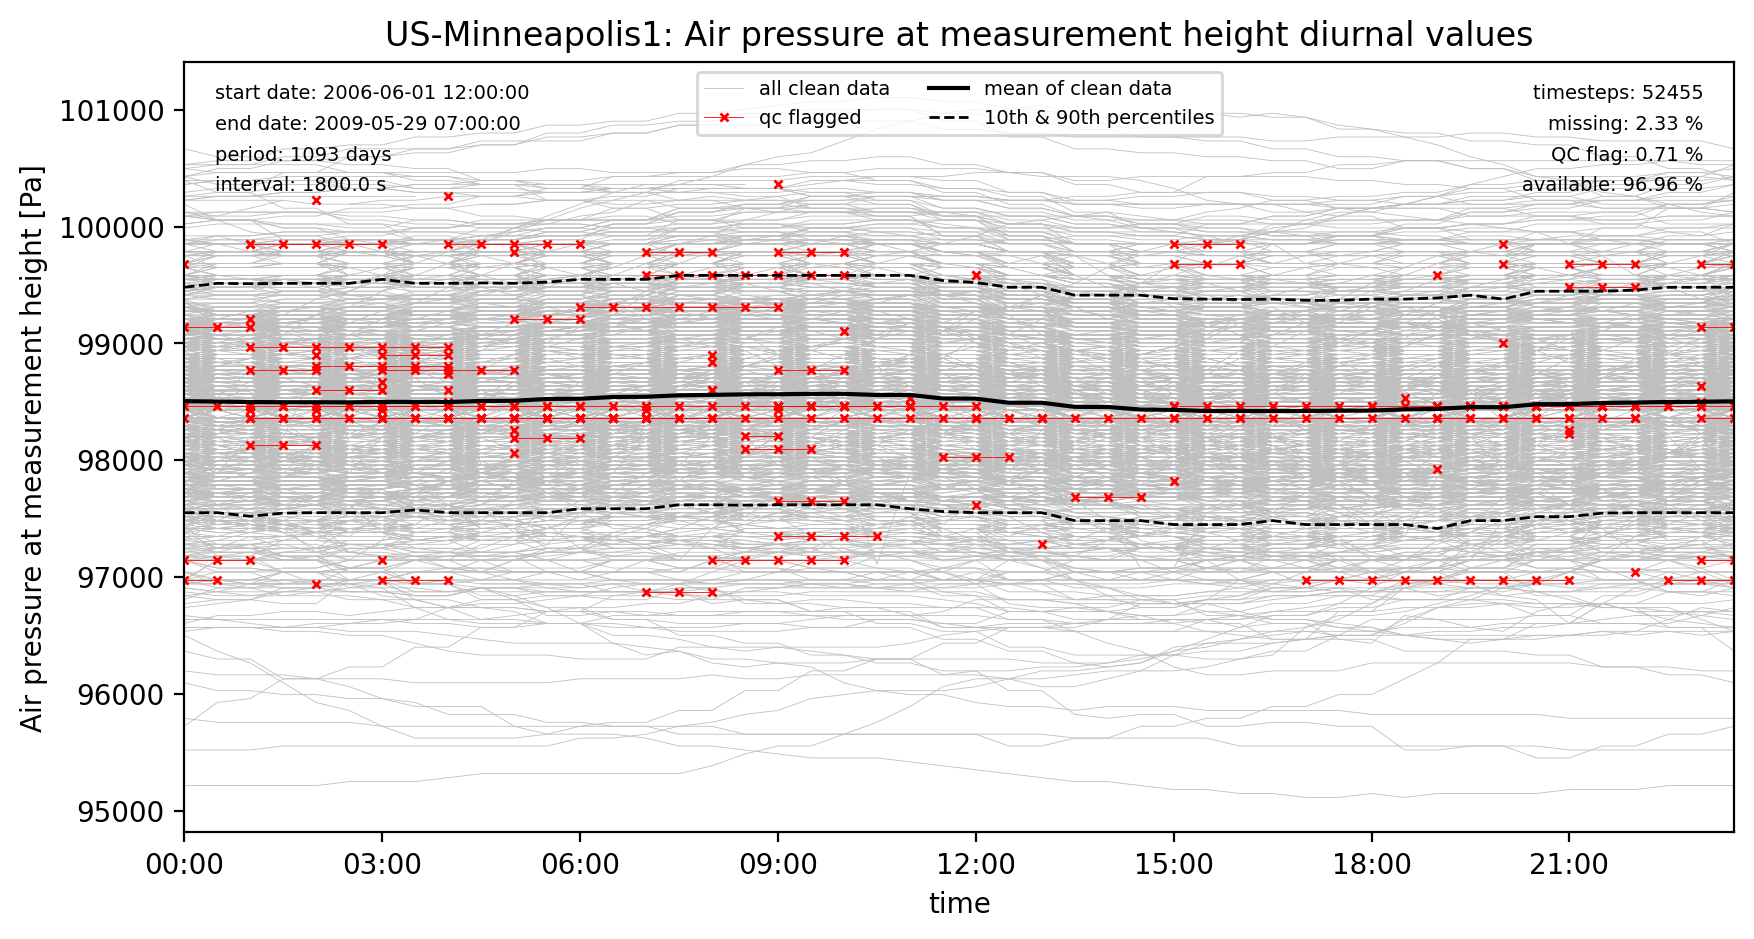
PSurf diurnal qc
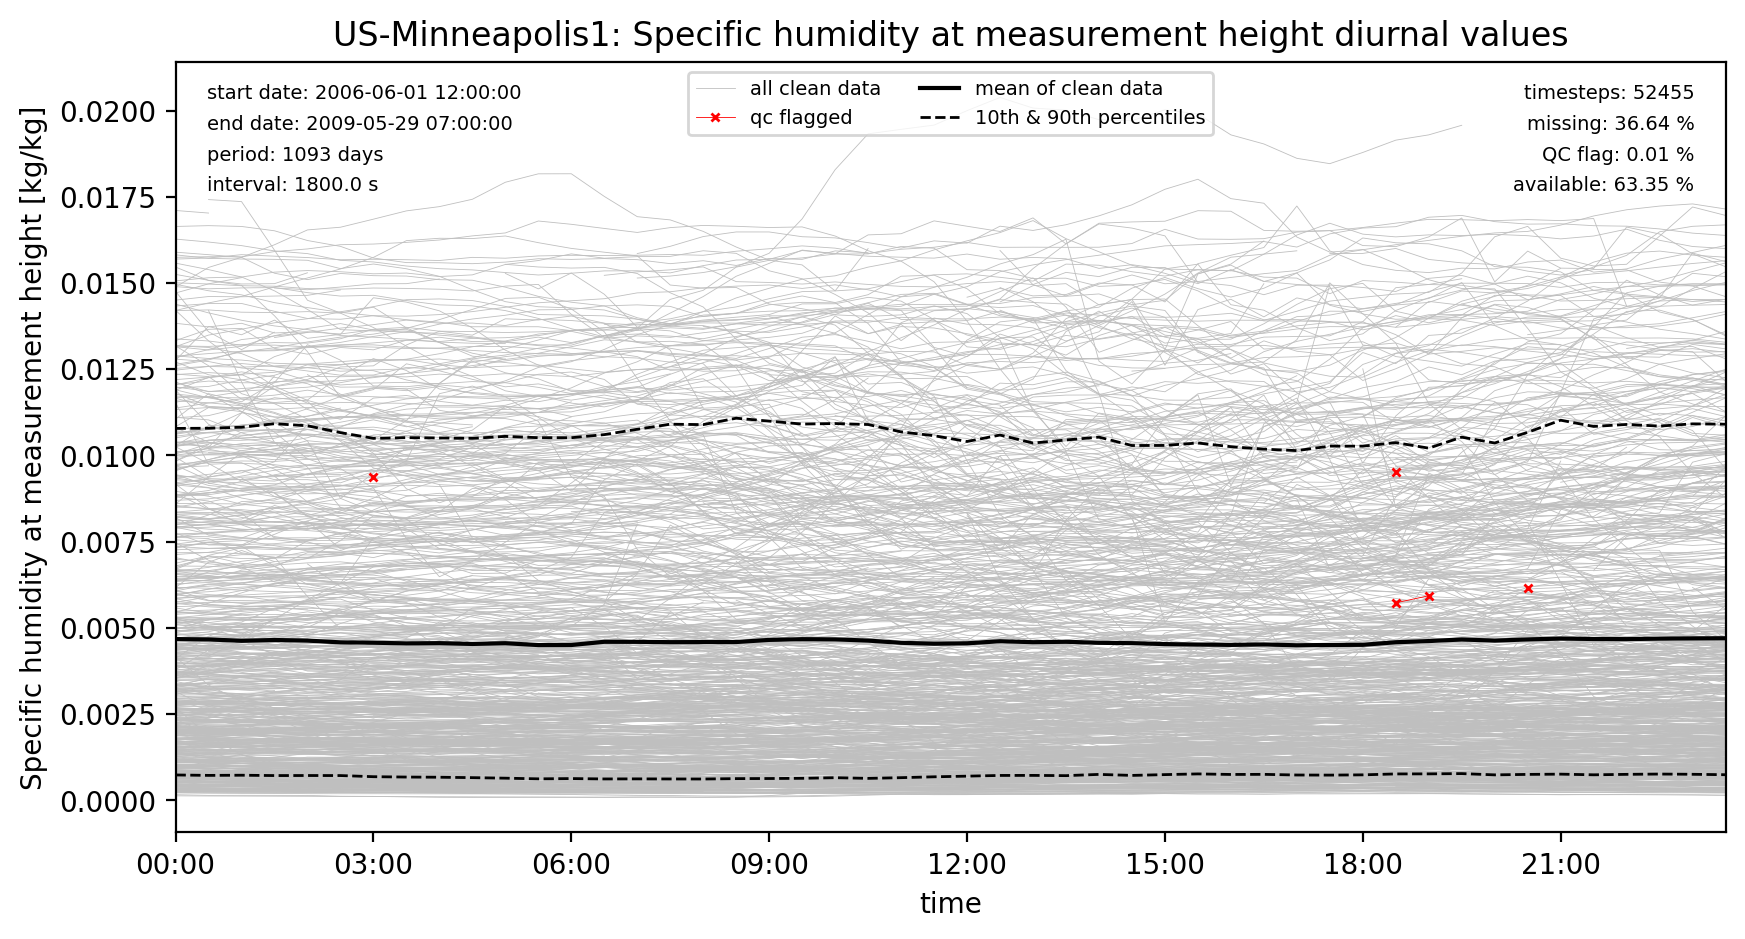
Qair diurnal qc
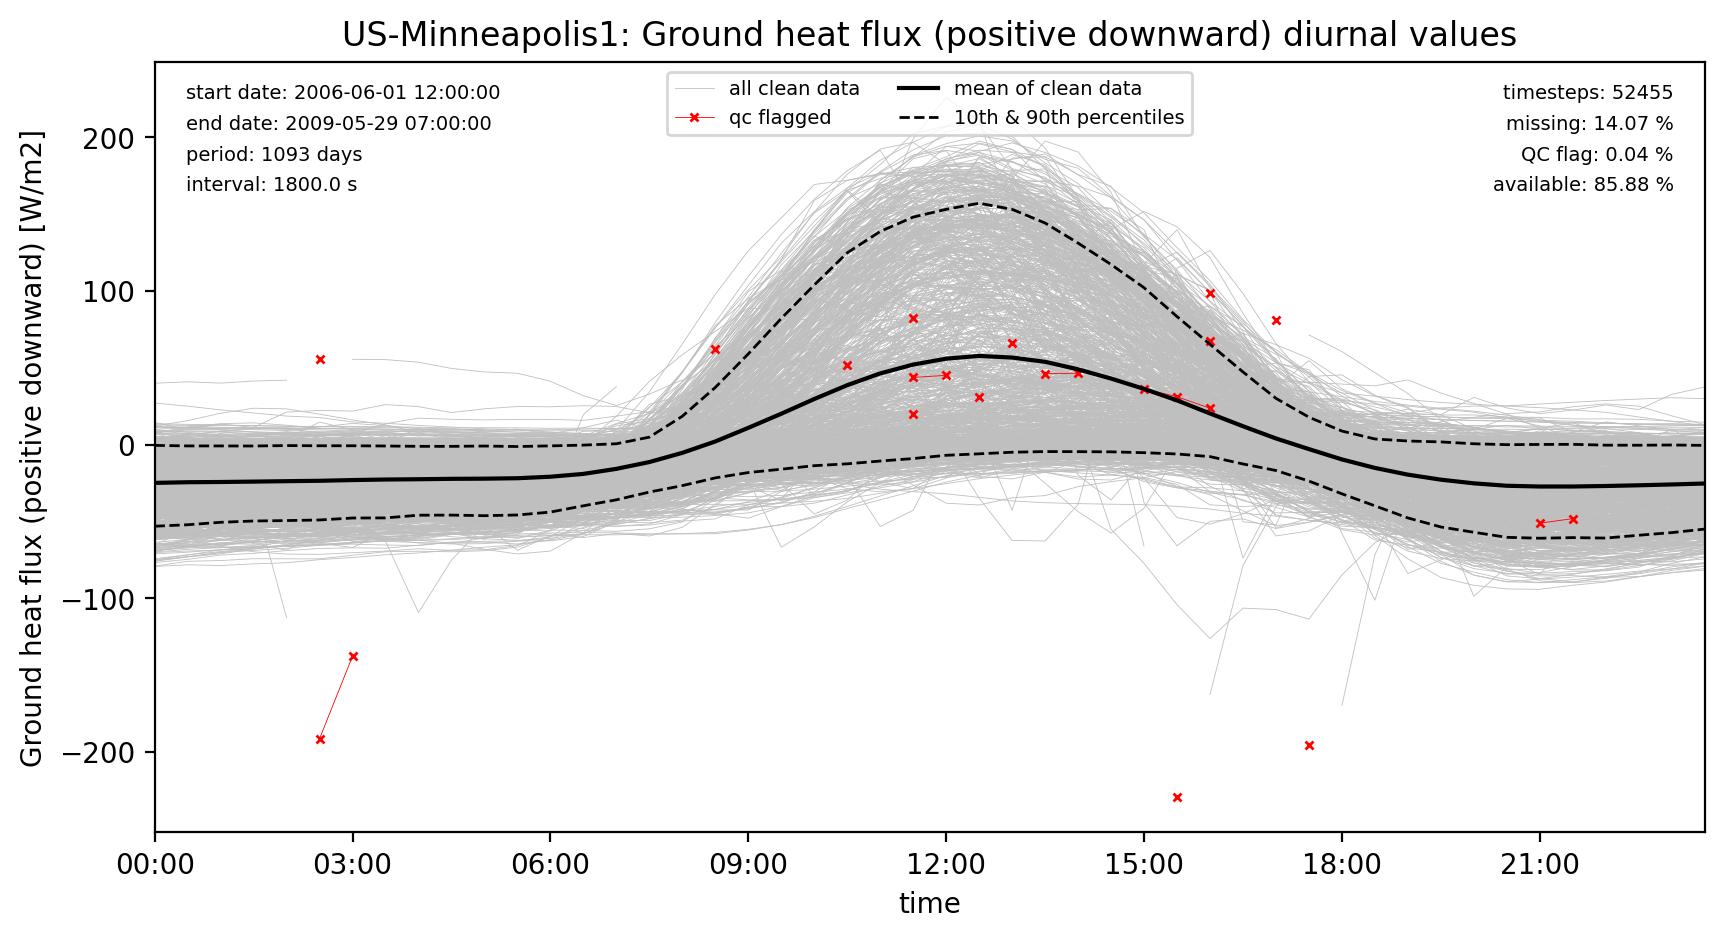
Qg diurnal qc
Qh diurnal qc
Qle diurnal qc
Qtau diurnal qc
Rainf diurnal qc
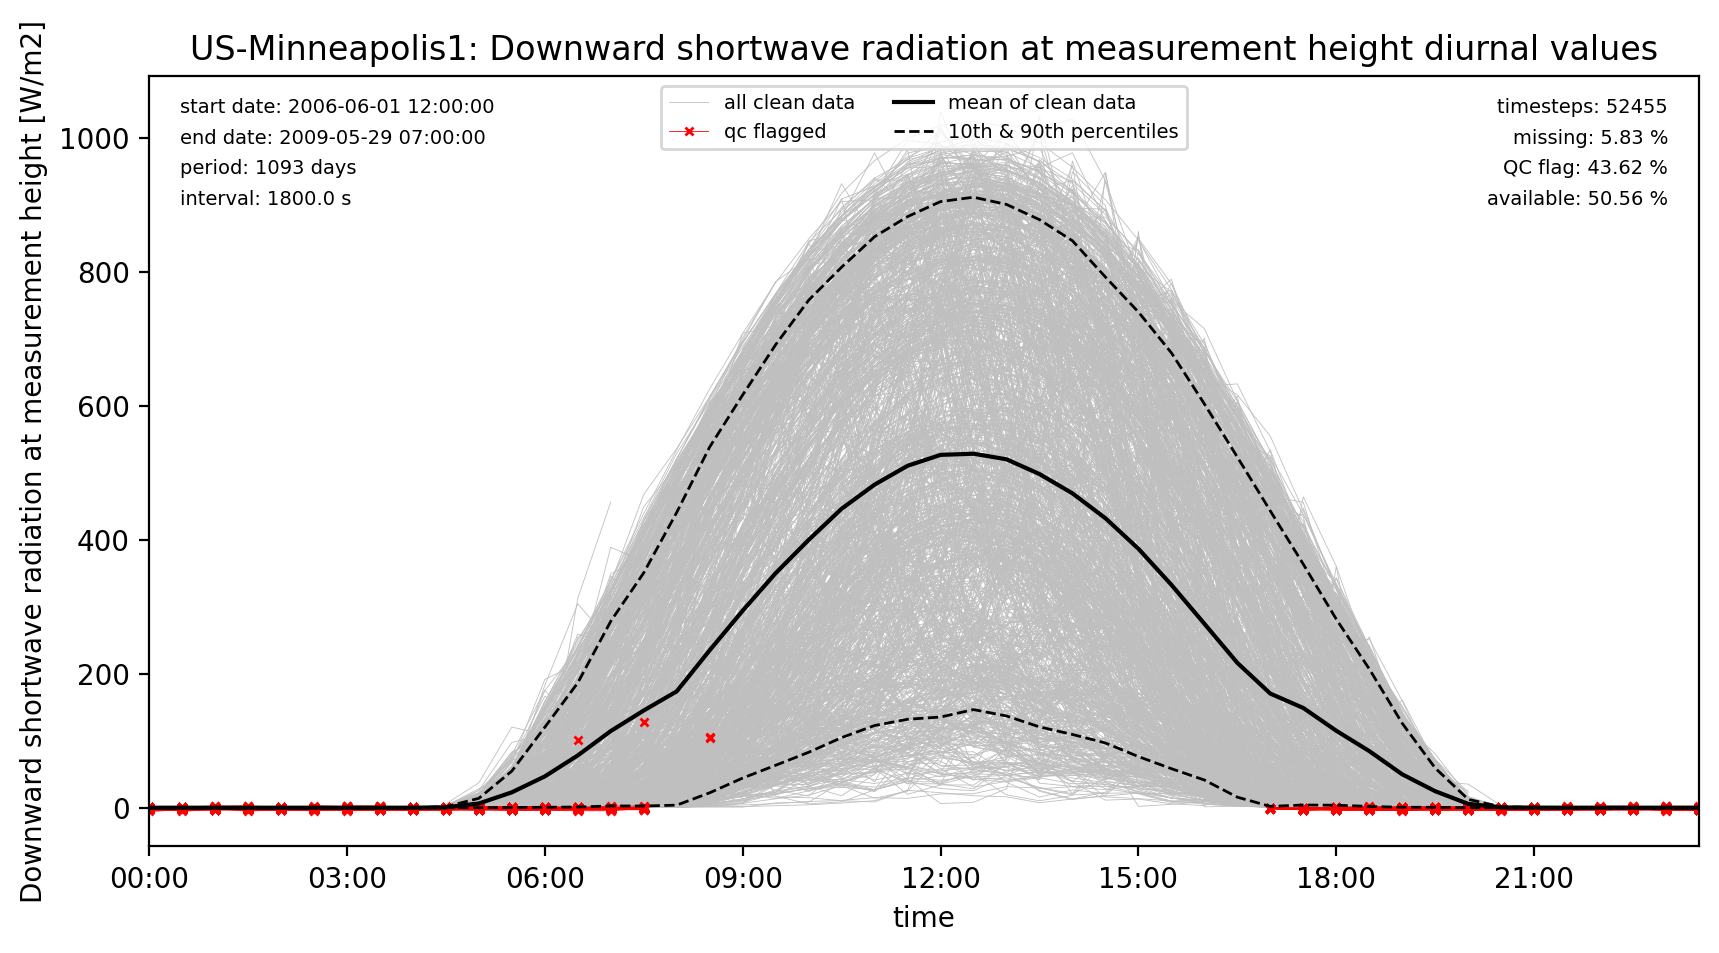
SWdown diurnal qc
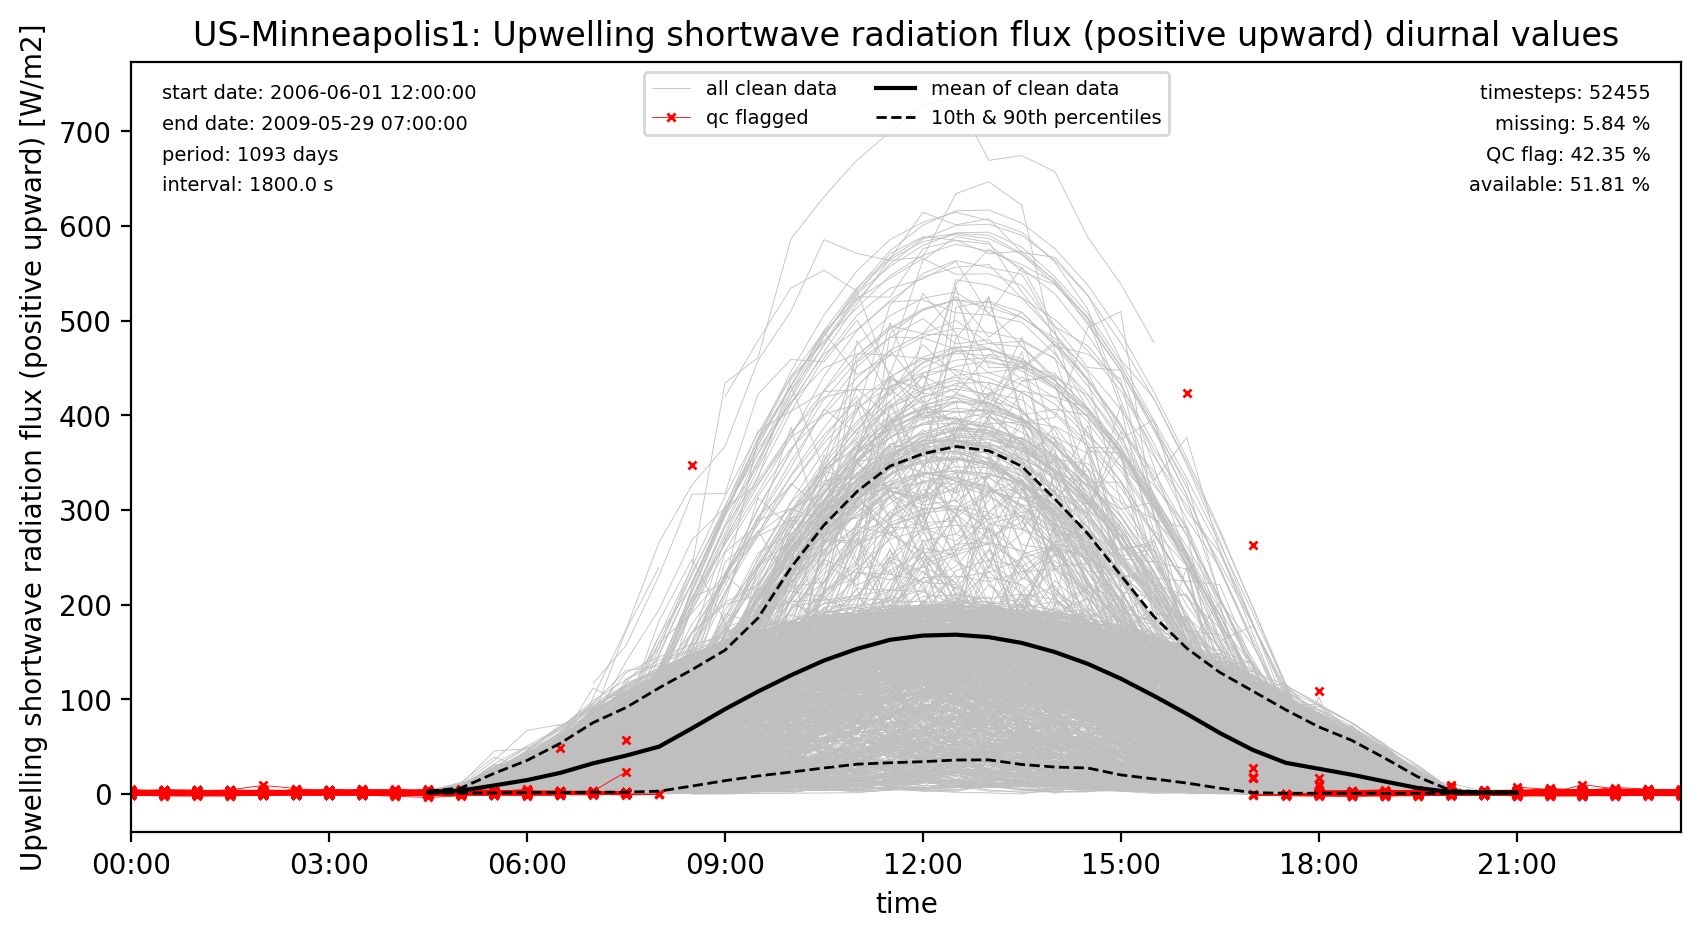
SWup diurnal qc
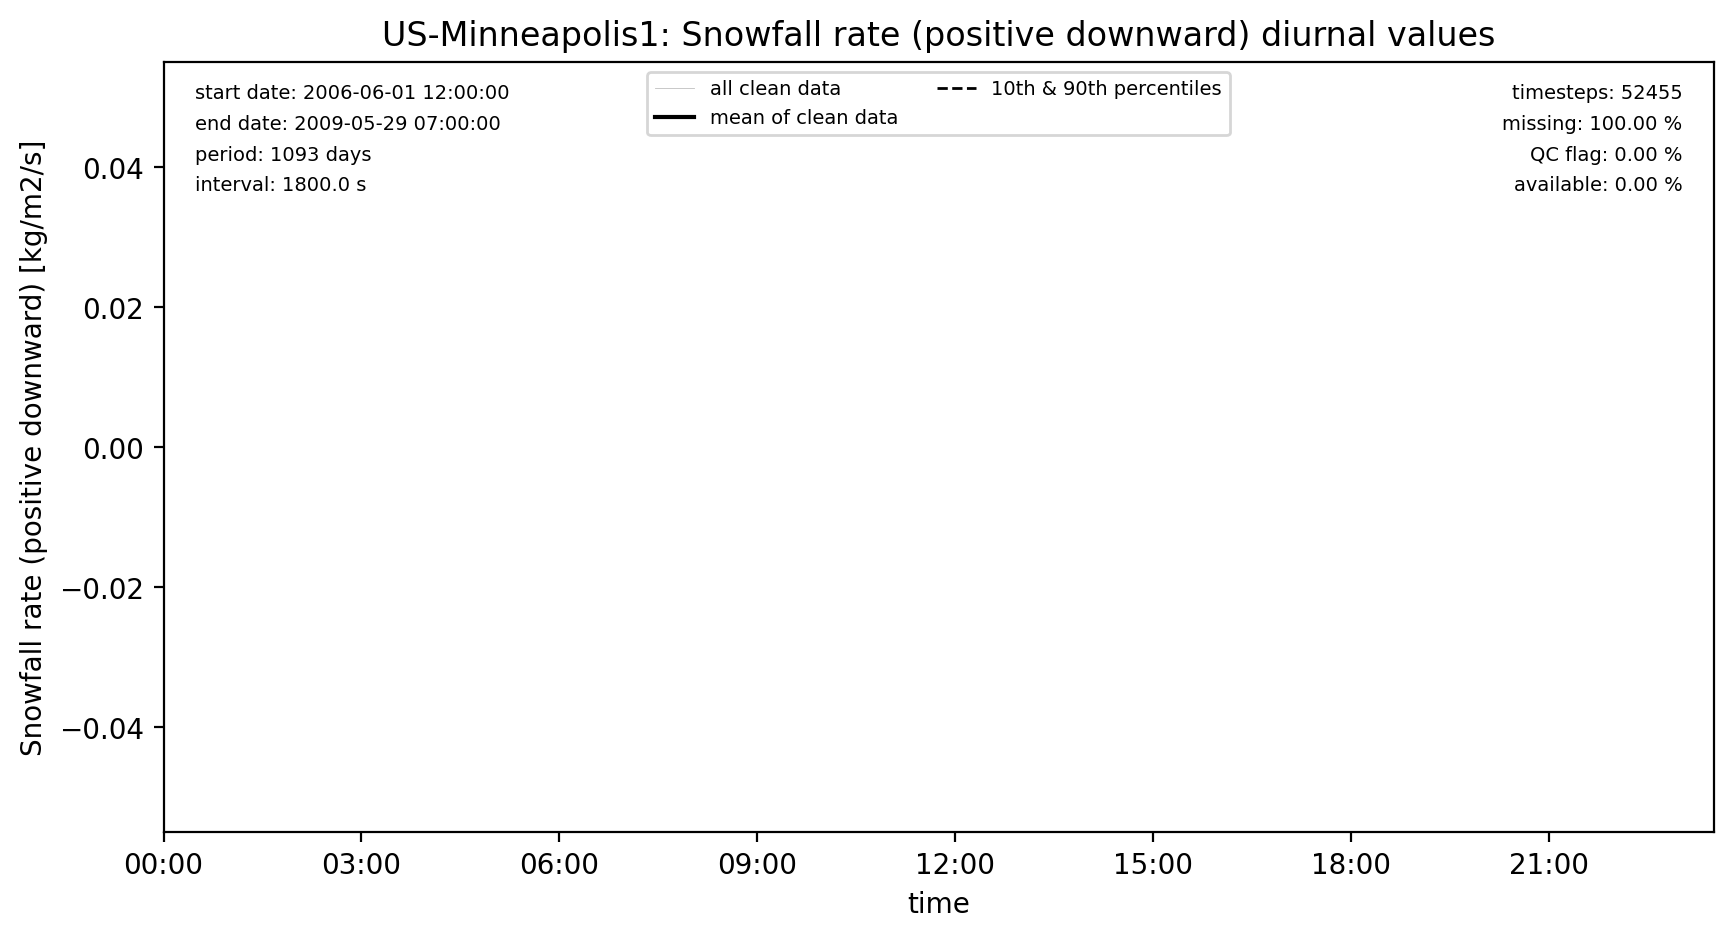
Snowf diurnal qc
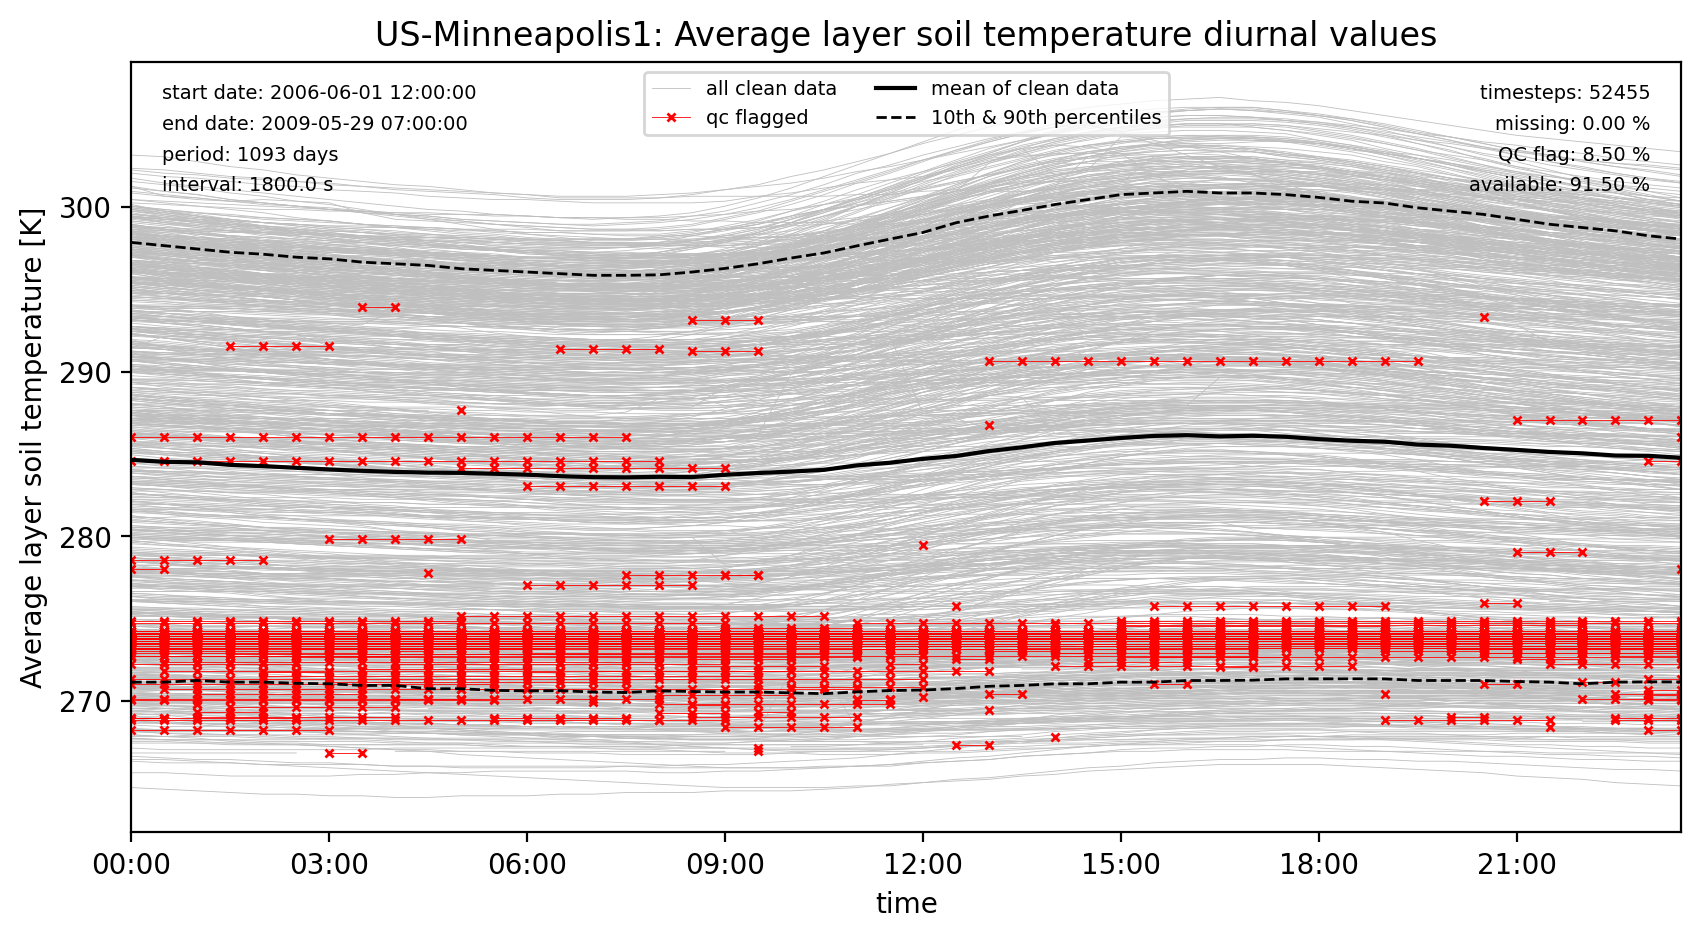
SoilTemp diurnal qc
Tair diurnal qc
Wind_E diurnal qc
Wind_N diurnal qc
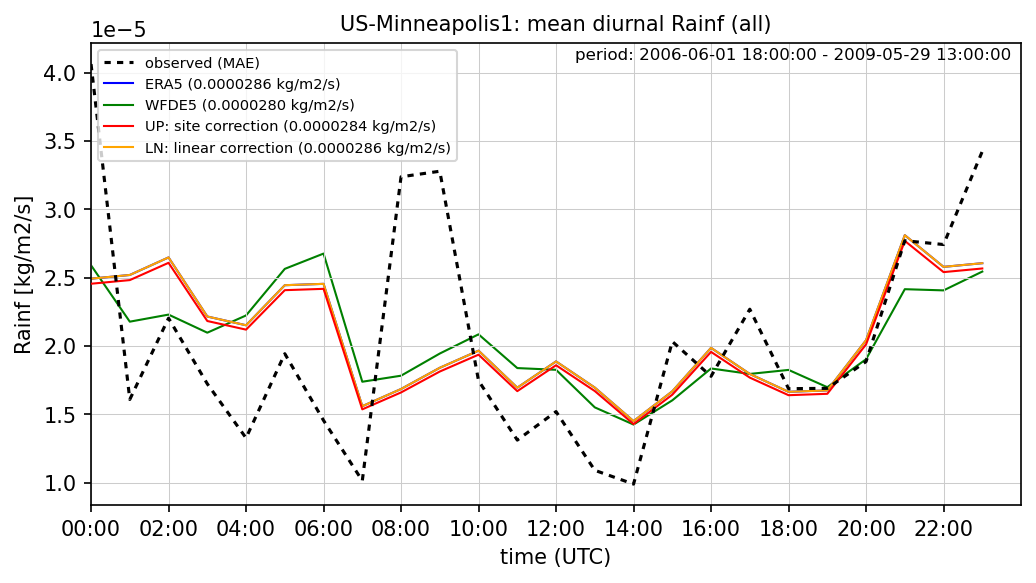
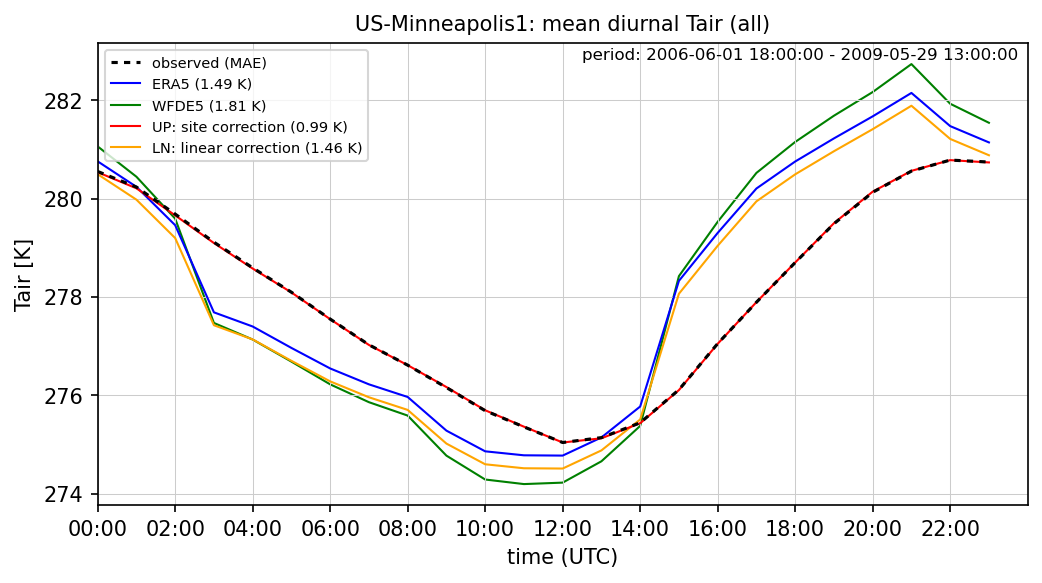
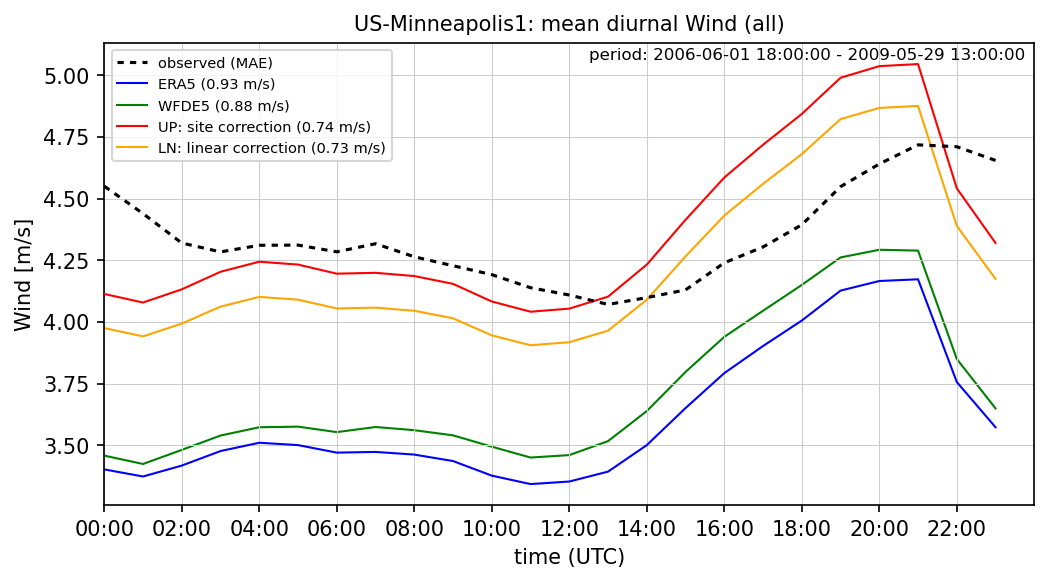
Bias correction diurnal comparison
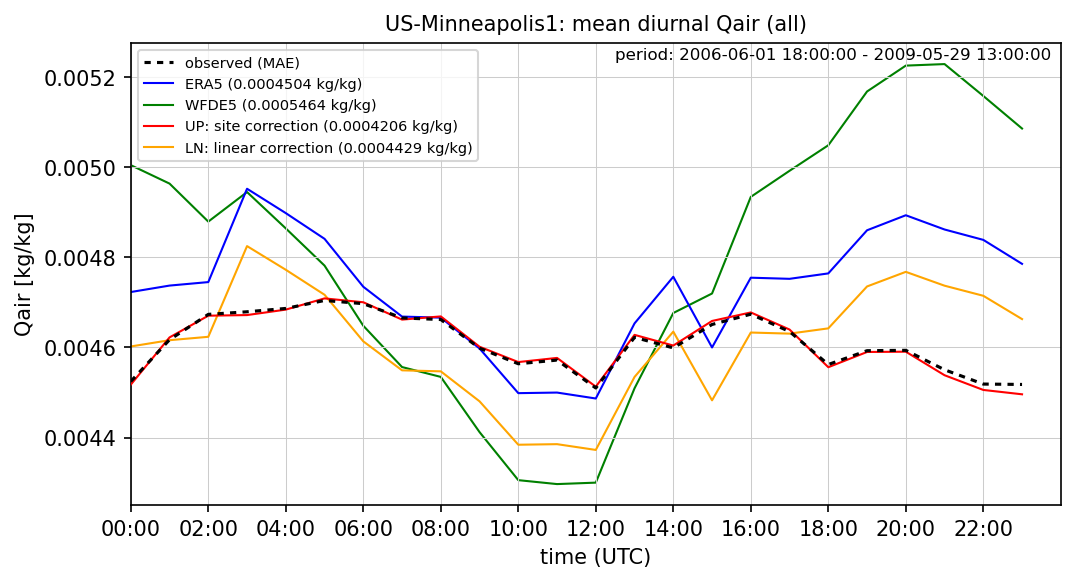
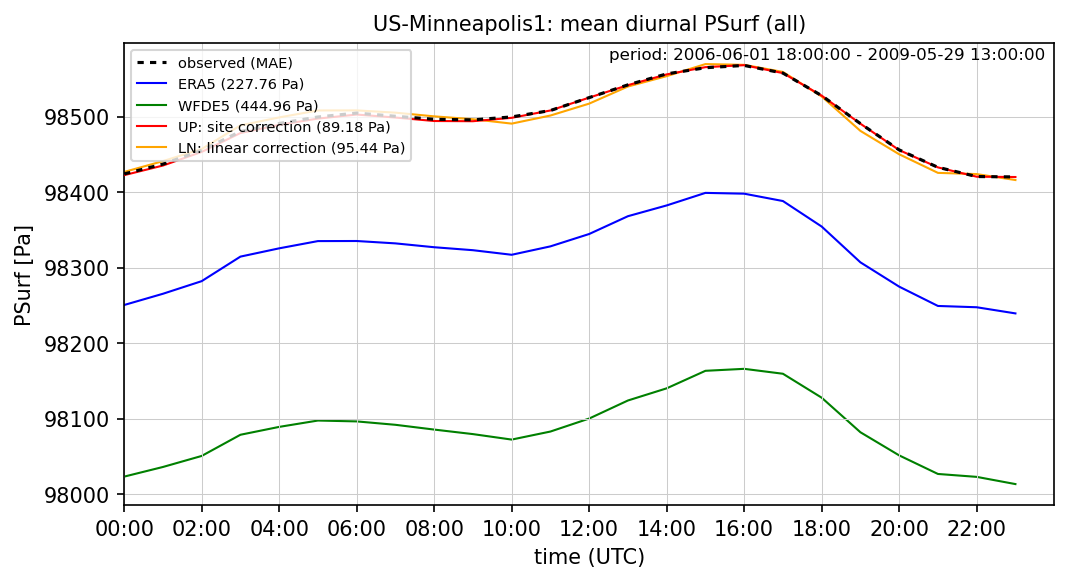
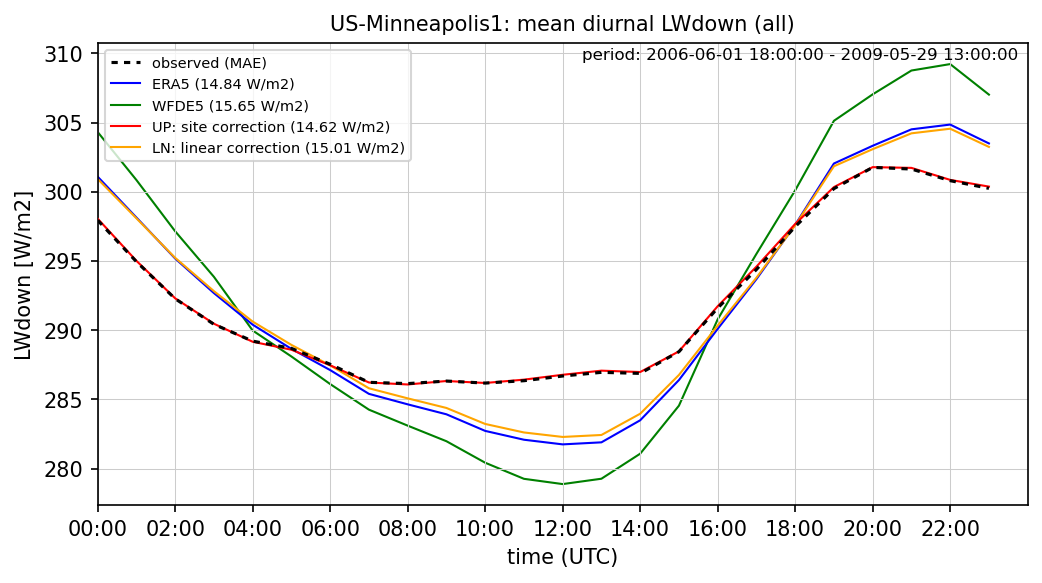
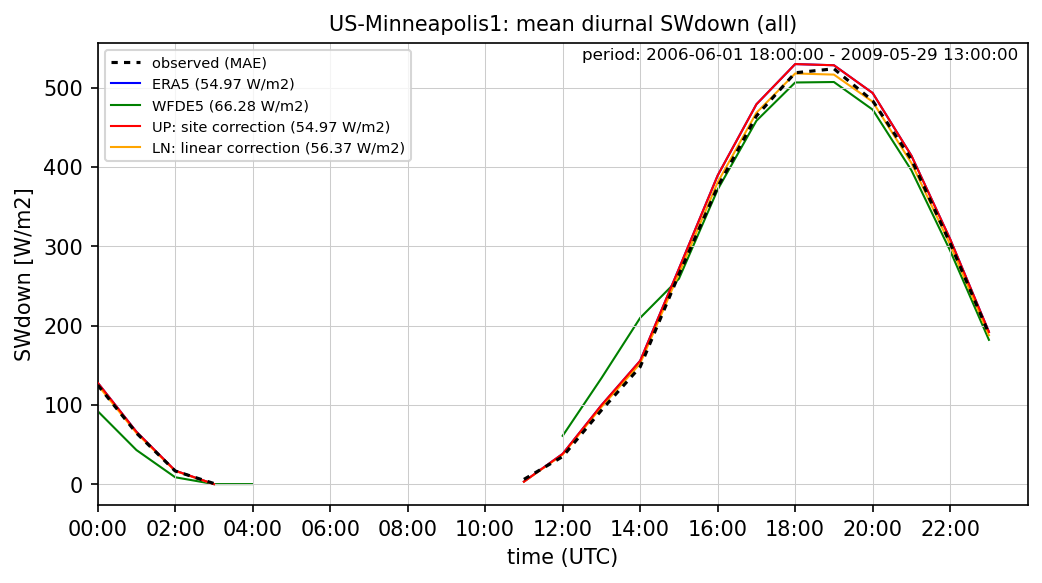
Four methods drawing on ERA5 reanalysis are compared relative to the quality-controlled flux tower data. The methods are:
- ERA5: the nearest land based 0.25° resolution ERA5 grid (i.e. without bias correction)
- WFDE5: the nearest WFDE5 grid (which use 0.5° gridded monthly observations for bias correction)
- UP: the Urban-PLUMBER methods used in this collection (using site observations for bias correction)
- LN: linear methods based on FLUXNET2015 (using site observations for bias correction)
ERA5 bias correction
The UP methods are as follows:
- for downwelling longwave, temperature, humidity and pressure: calculate the mean bias between ERA5 and flux tower data in a 30-day rolling window for every hour and each day of the year, apply that bias correction to all ERA5 data. For periods not covered by observations, linearly interpolate between known biases for each hour separately.
- for precipitation: calculate total precipitation in a 10-year period and calculate the ratio between ERA5 data and the nearest GHCN-D station and apply that correction factor to ERA5 data.
- for wind: apply wind log profile correction from ERA5 10m wind to tower measurement height using site roughness and displacement, with original grid roughness iteratively revised so that mean corrected wind speed matches observation.
- for downwelling shortwave: use ERA5 data without correction
Mean absolute error (MAE) is shown in the legend.
Tair diurnal bias correction
Qair diurnal bias correction
PSurf diurnal bias correction
LWdown diurnal bias correction
SWdown diurnal bias correction
Wind diurnal bias correction
Rainf diurnal bias correction