NOTE: Results presented here are highly dependent on how models are configured in this experiment and may be subject to variable output formatting errors. Results are not intended to indicate the quality of any individual model, but to help participants better understand and improve modelling approaches in different urban environments.
AU-Preston results (supplementary)
The following supplements results reported in the article:
The Urban-PLUMBER model intercomparison for urban areas: description and Phase 1 results
Refer to the published article for interpretation of figures and for referencing.
Also see:
Fig. S1: Benchmark evaluation: extreme metric group
Metrics: 5th, 95th as defined in Table A.1. See Figure 8 caption in the original article for further details.
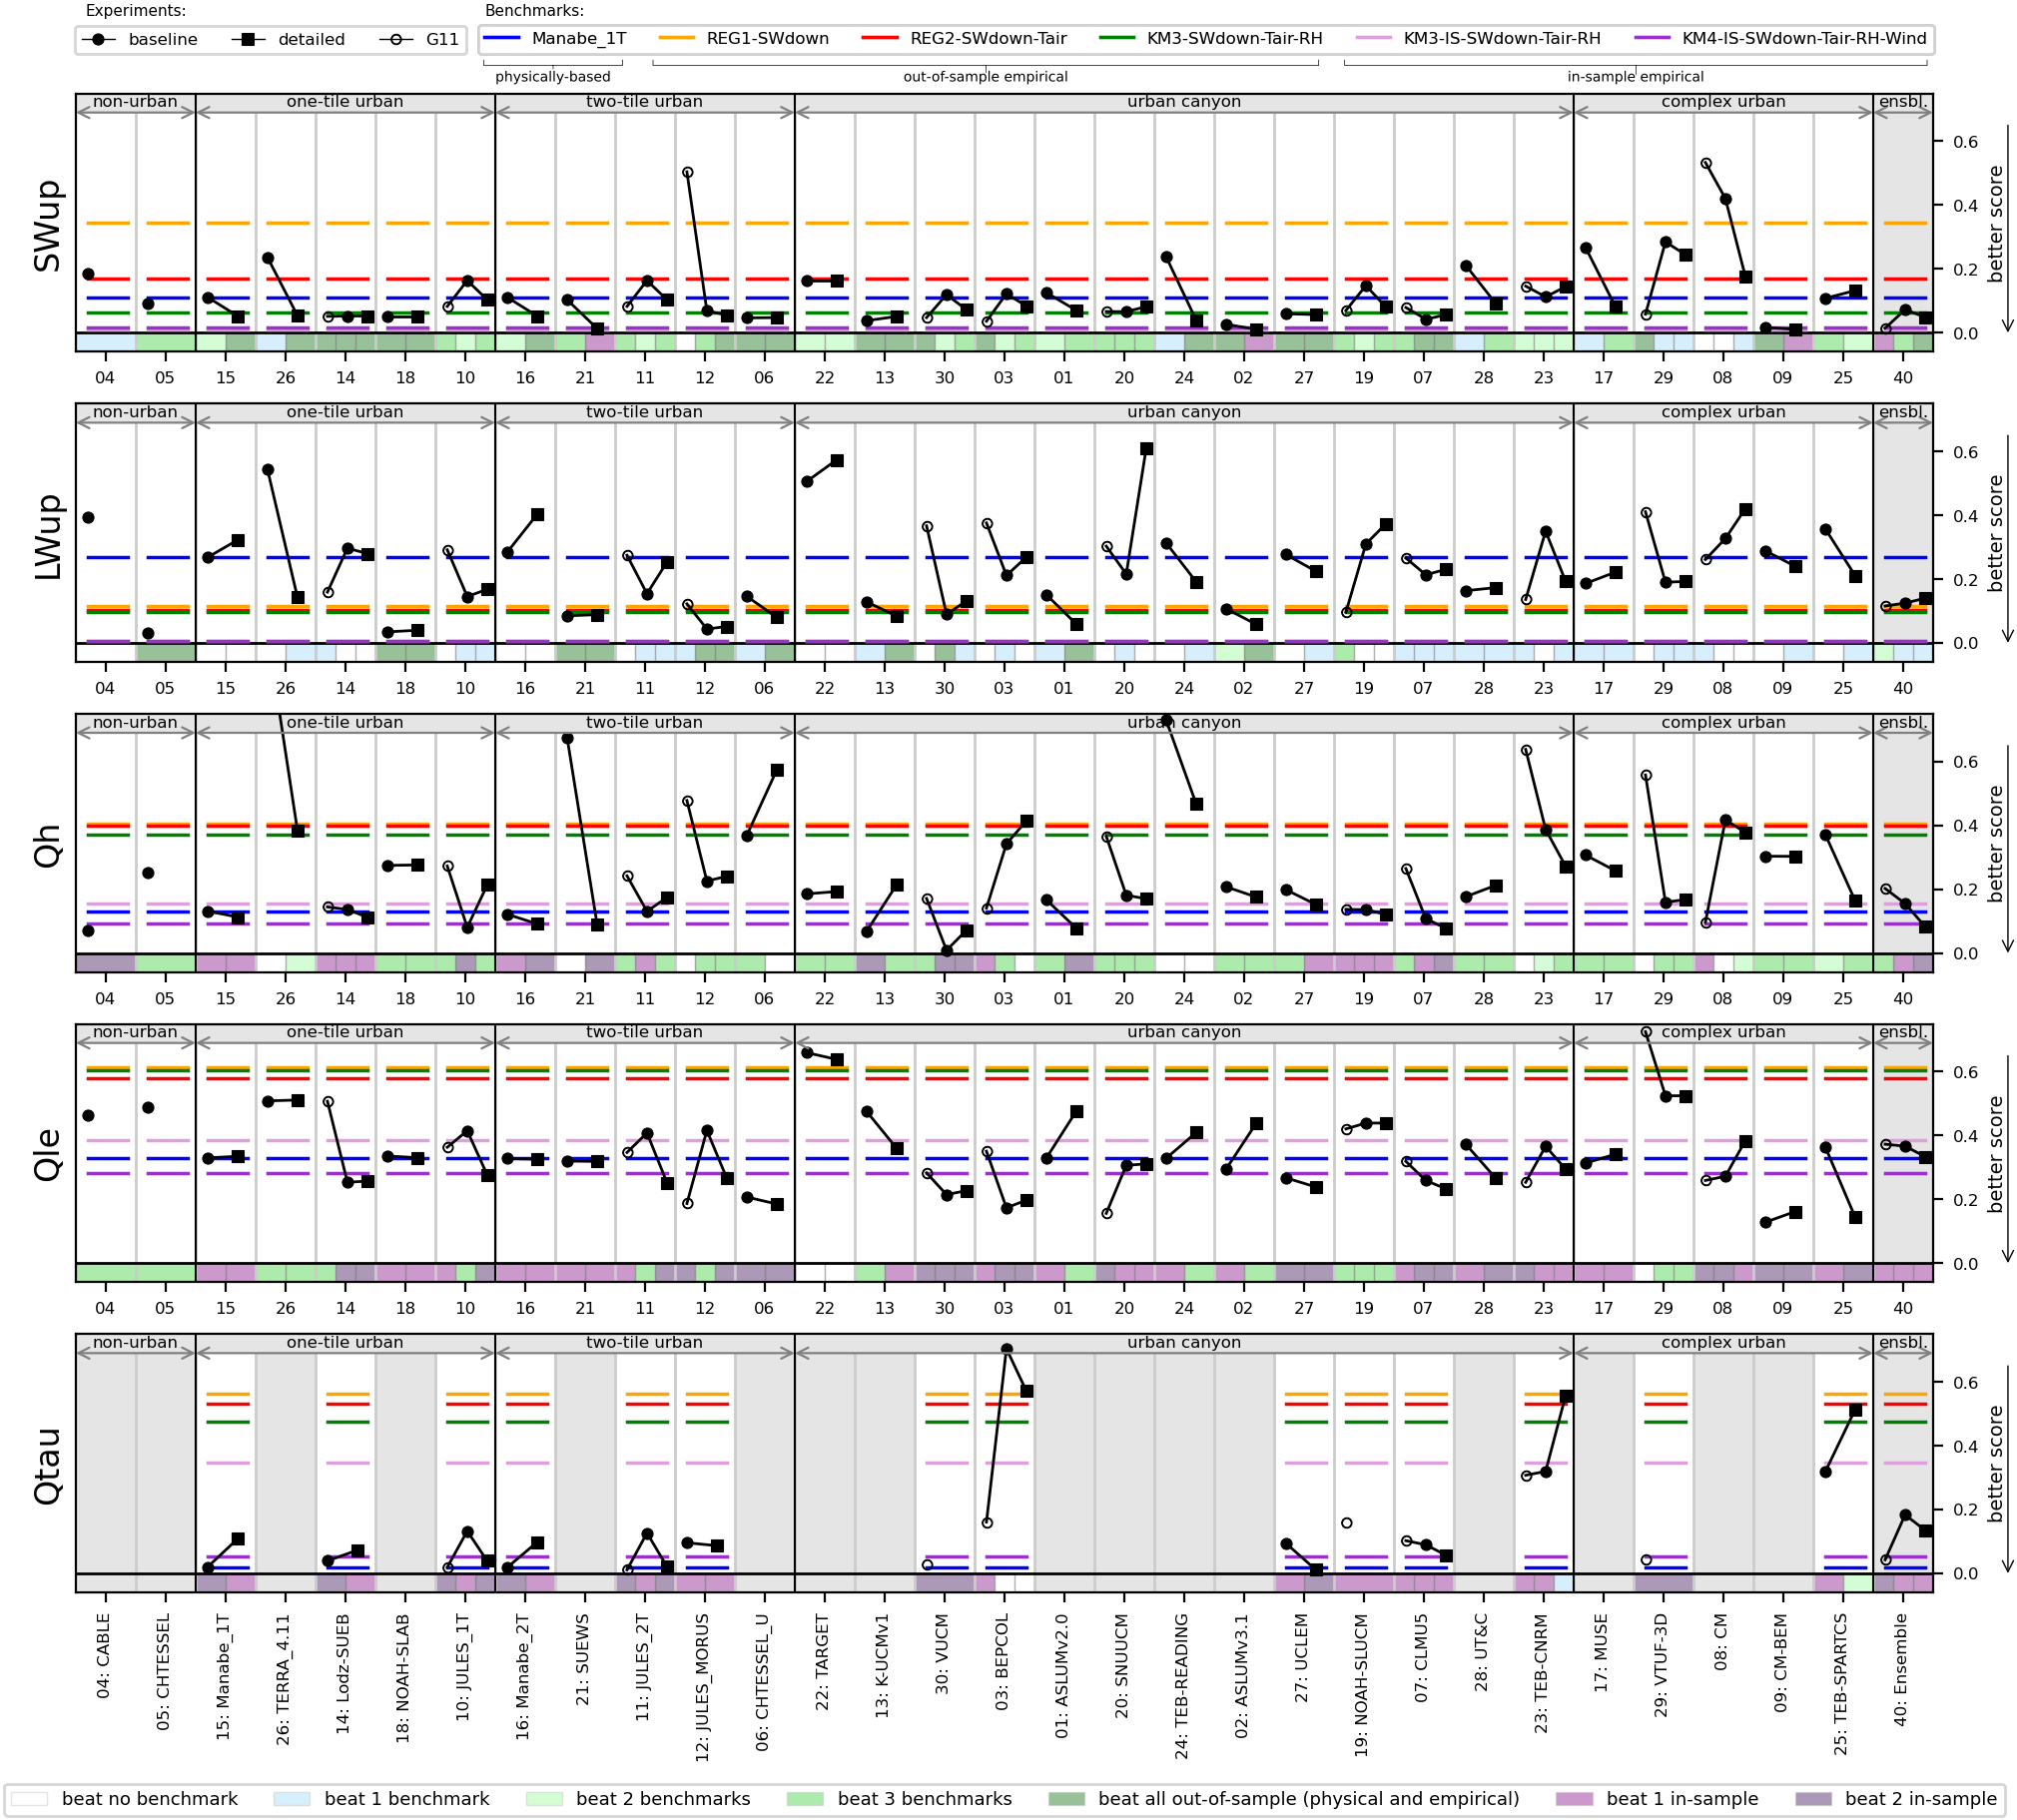
Fig. S2: Benchmark evaluation: distribution metric group
Metrics: nSkewness, nKurtosis, Overlap as defined in Table A.1. See Figure 8 caption in the original article for further details.
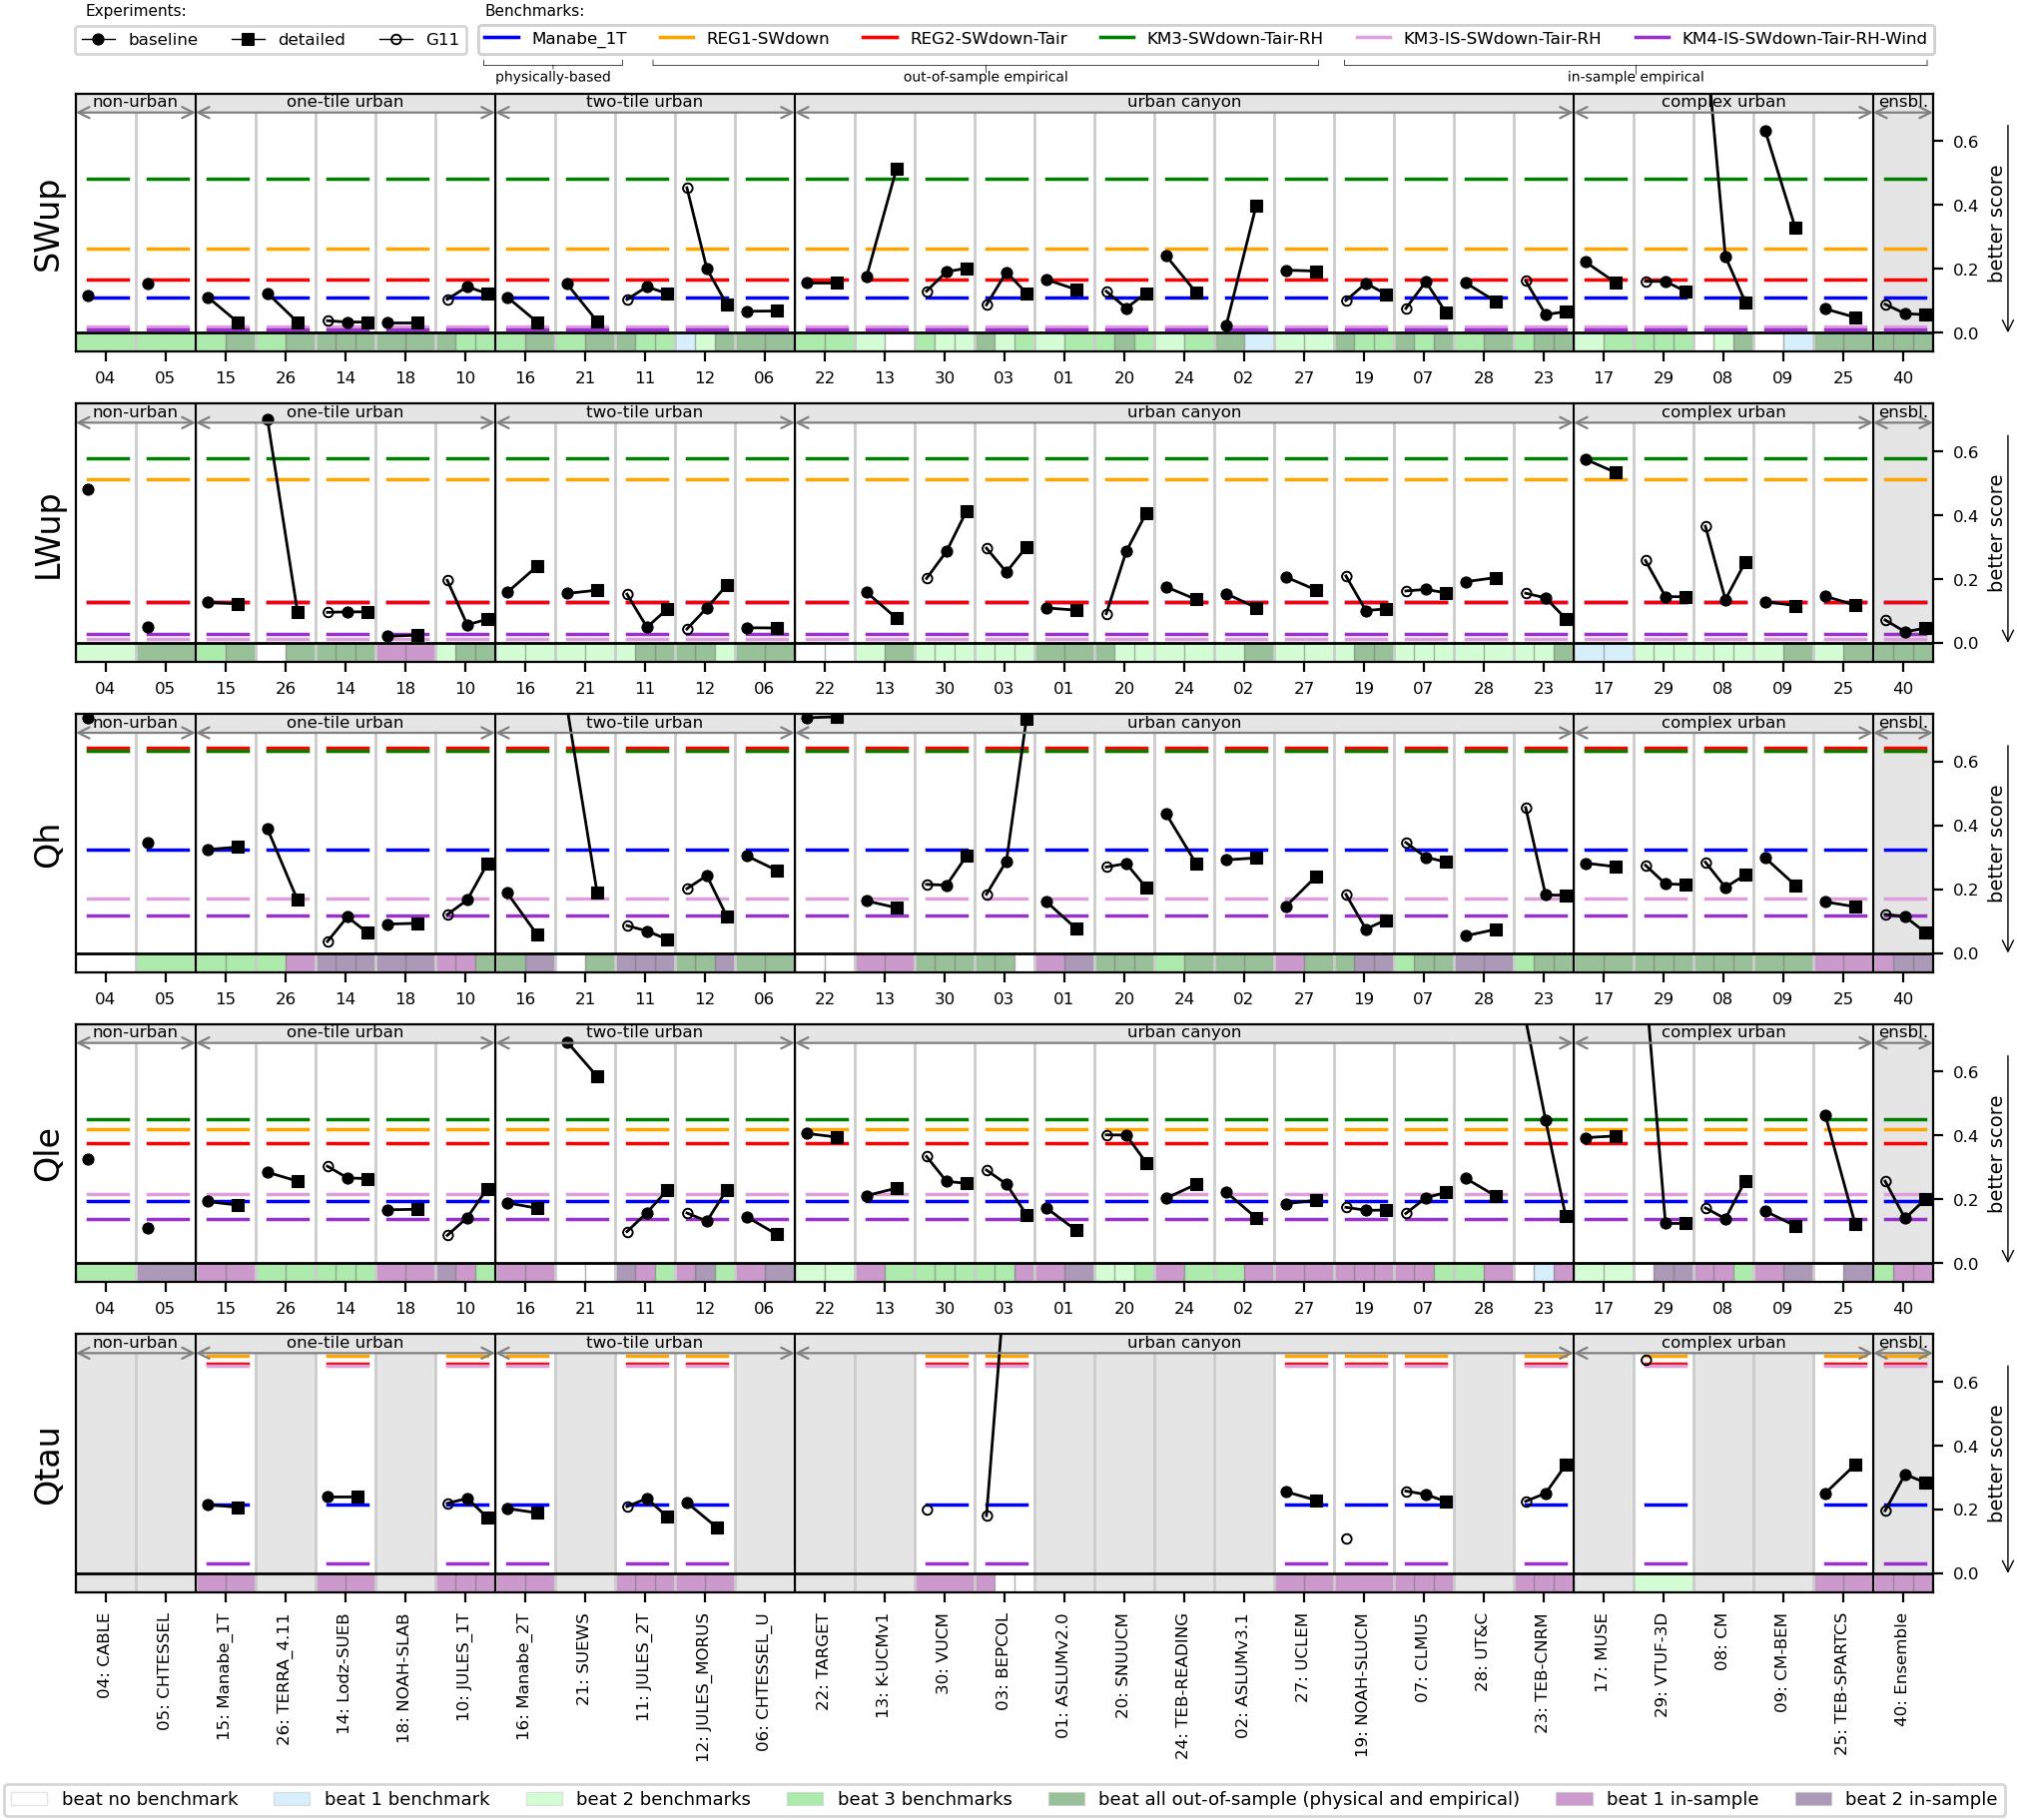
Fig. S3: Benchmark evaluation: all metrics aggregated
All metrics as defined in Table A.1. See Figure 8 caption in the original article for further details.
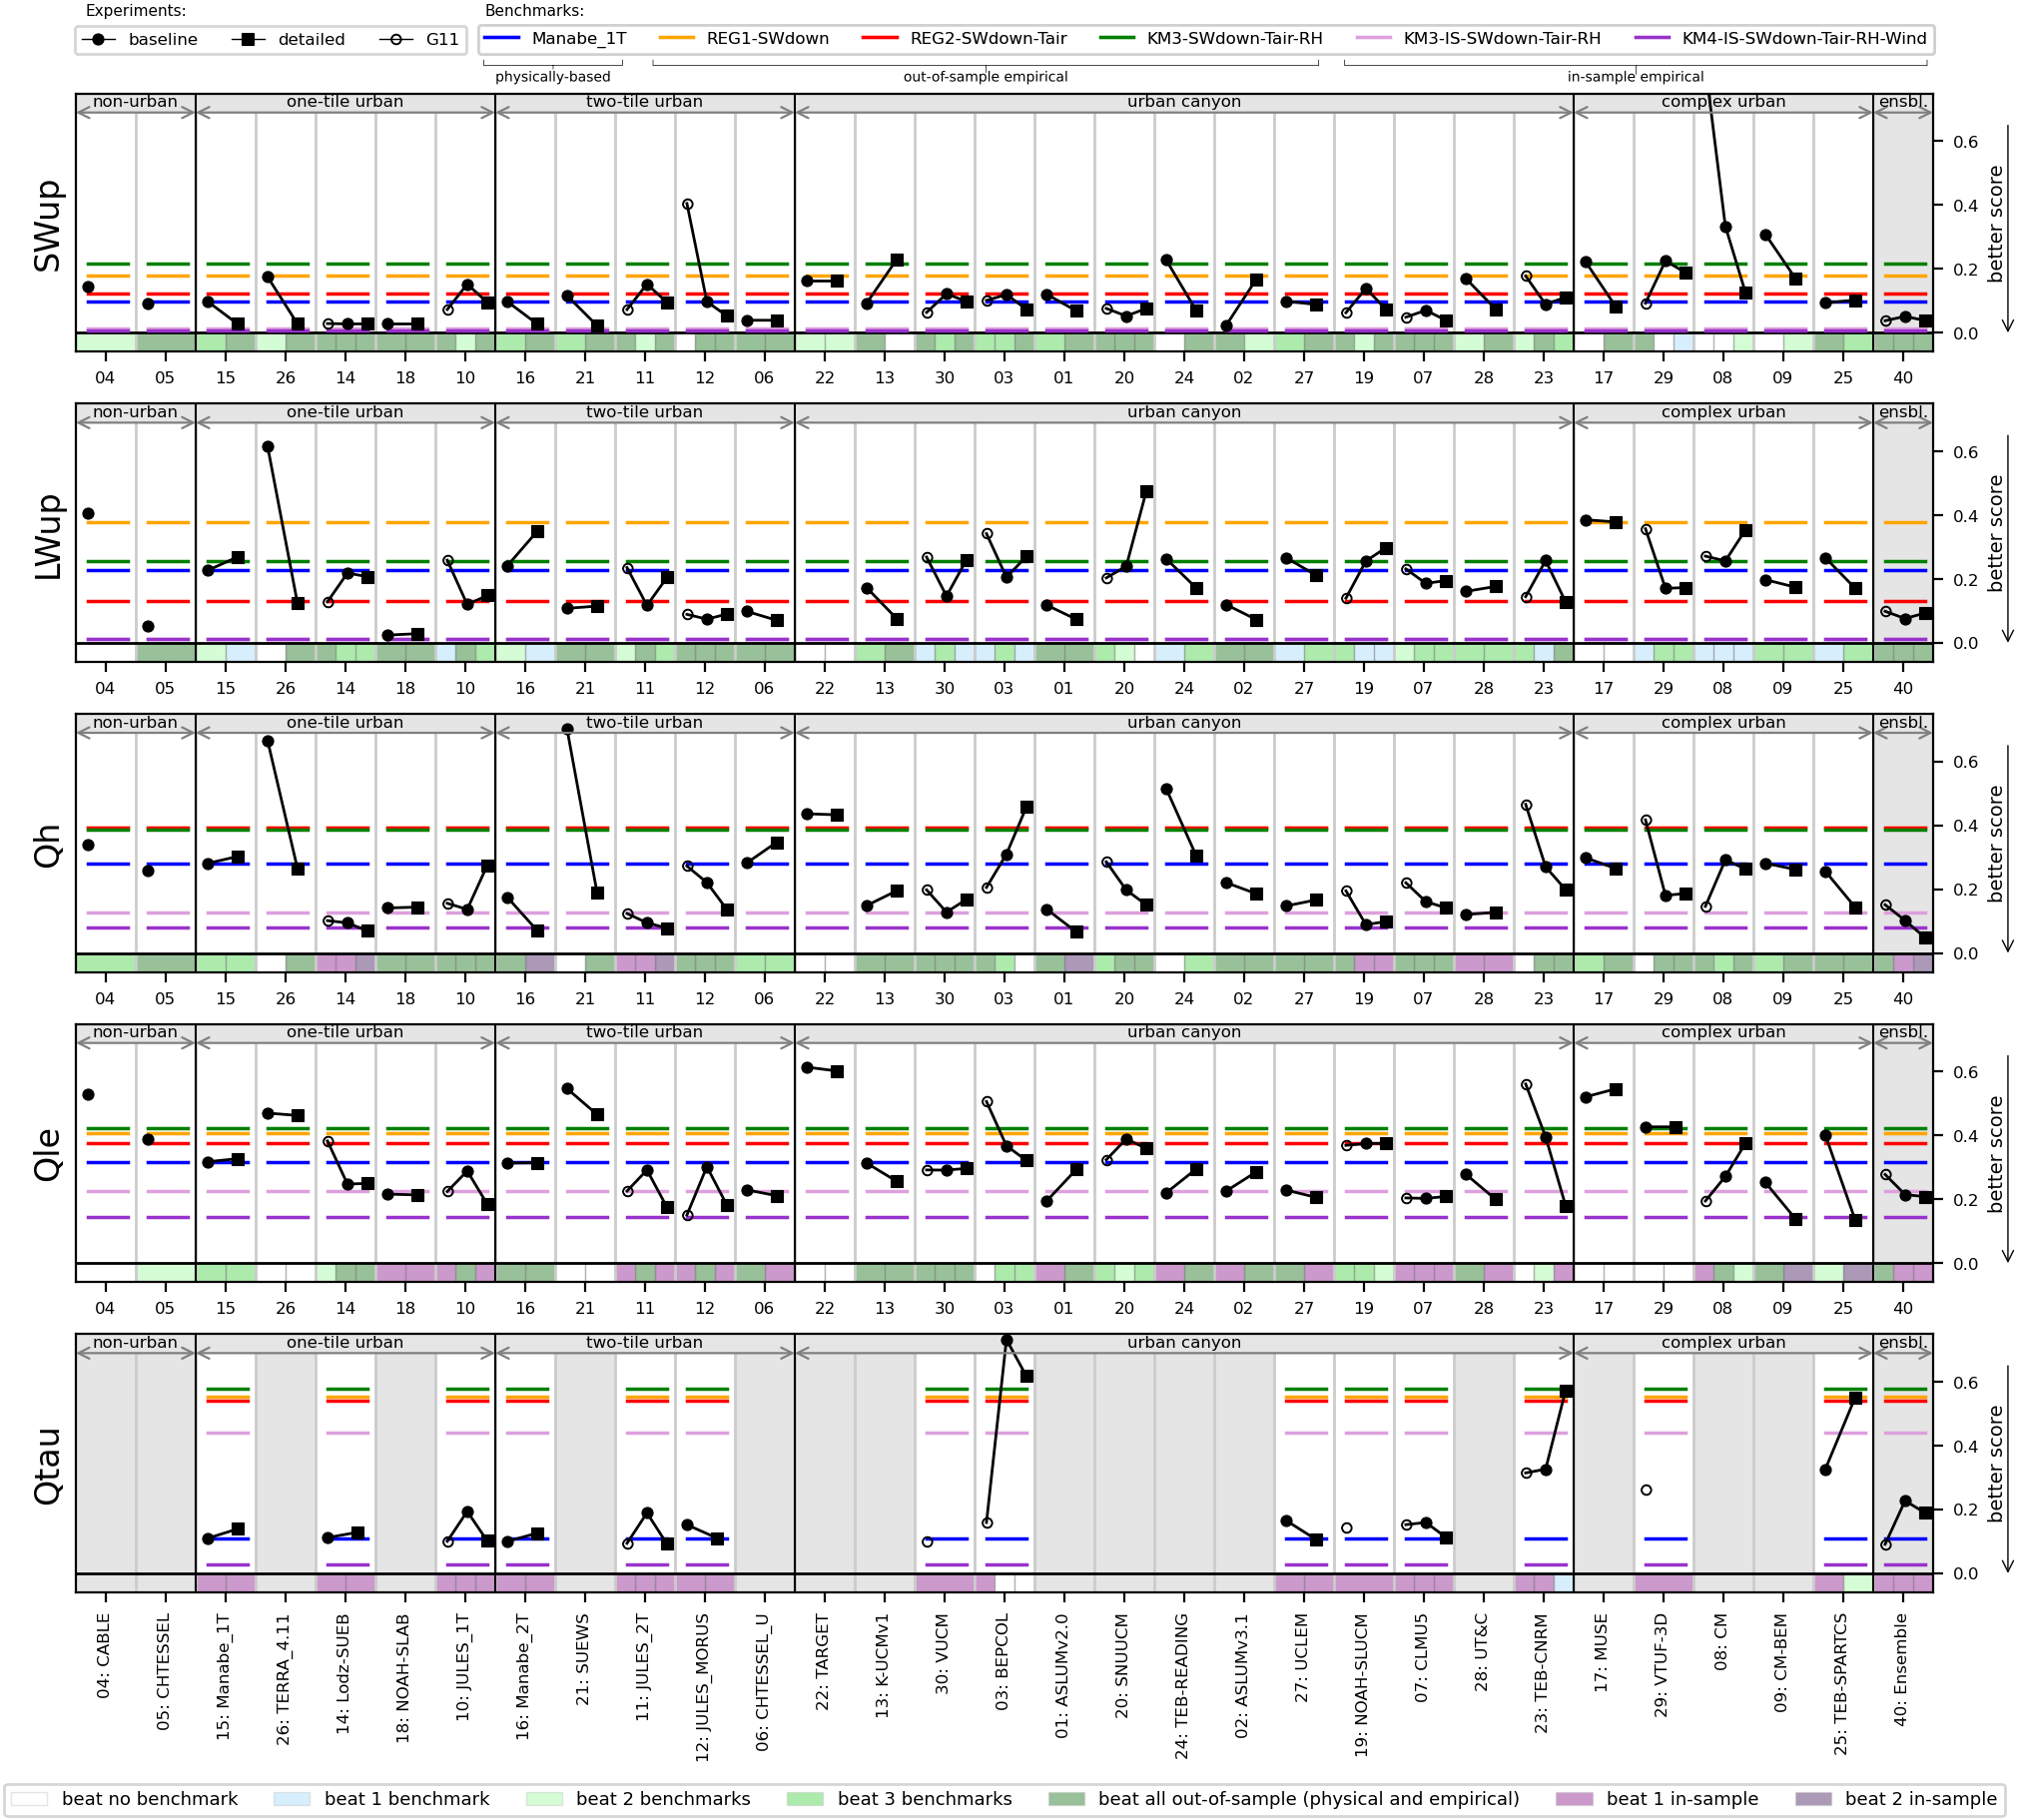
Fig. S4: By cohort (only models with SWup correlation>0.99)
All models with lower SWup correlation excluded. See Figure 6 caption in the original article for further details.
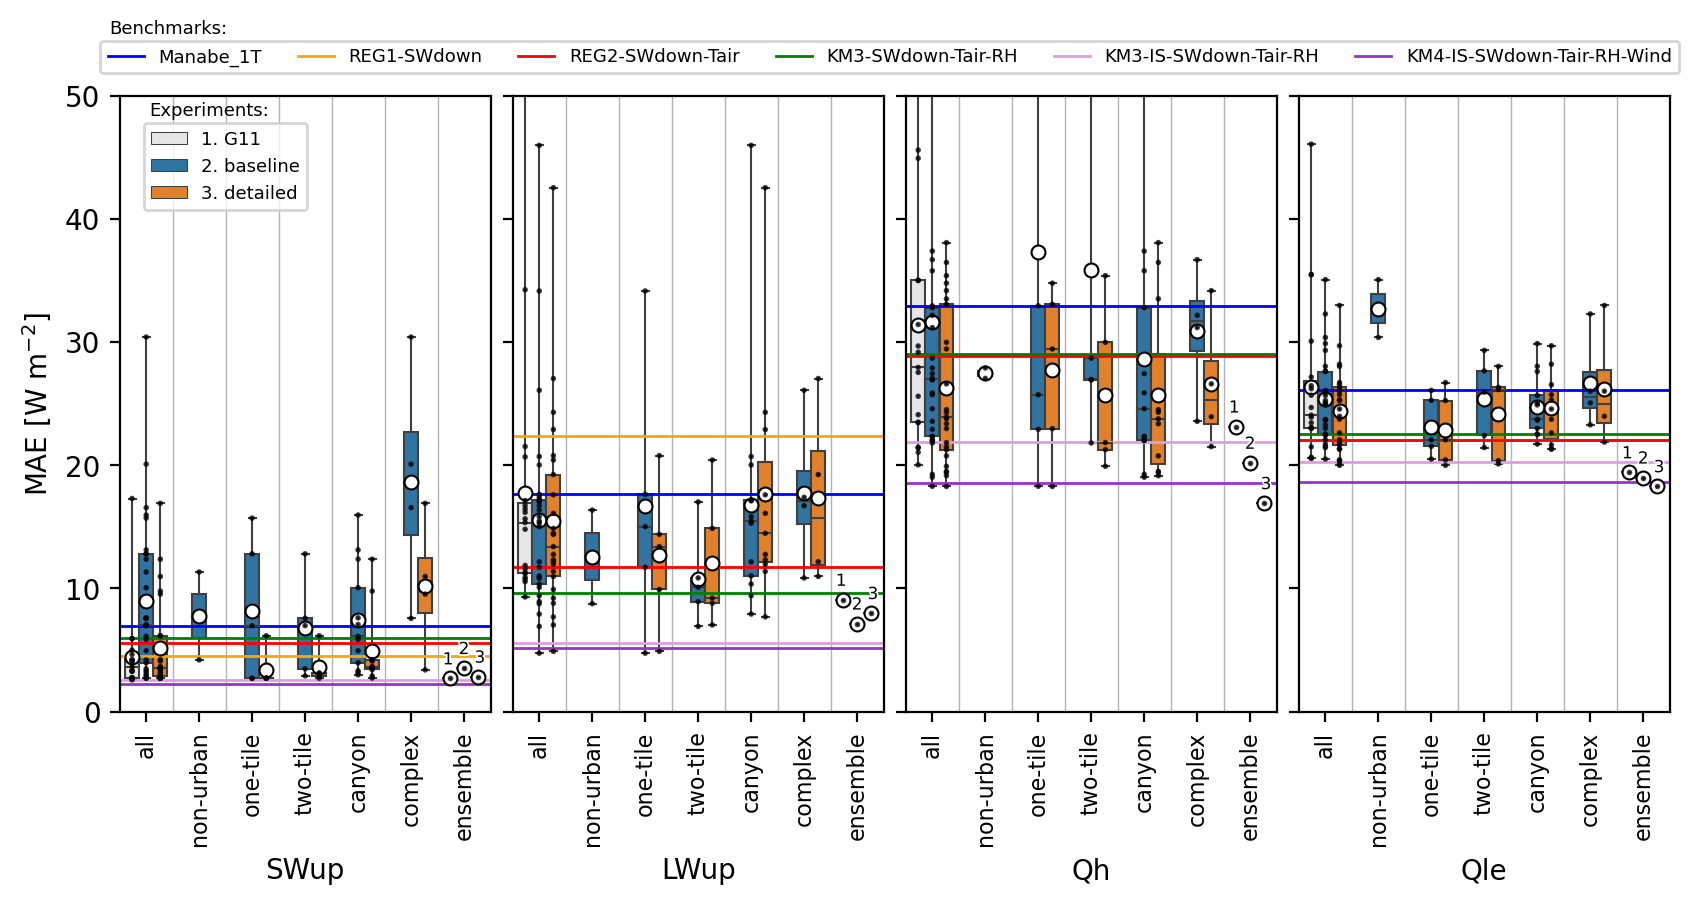
Fig. S5: Comparison of initial and baseline submissions
Mean absolute error (MAE) improvement from the first (initial) to the final baseline submission, with the number of submissions and direction of improvement indicated
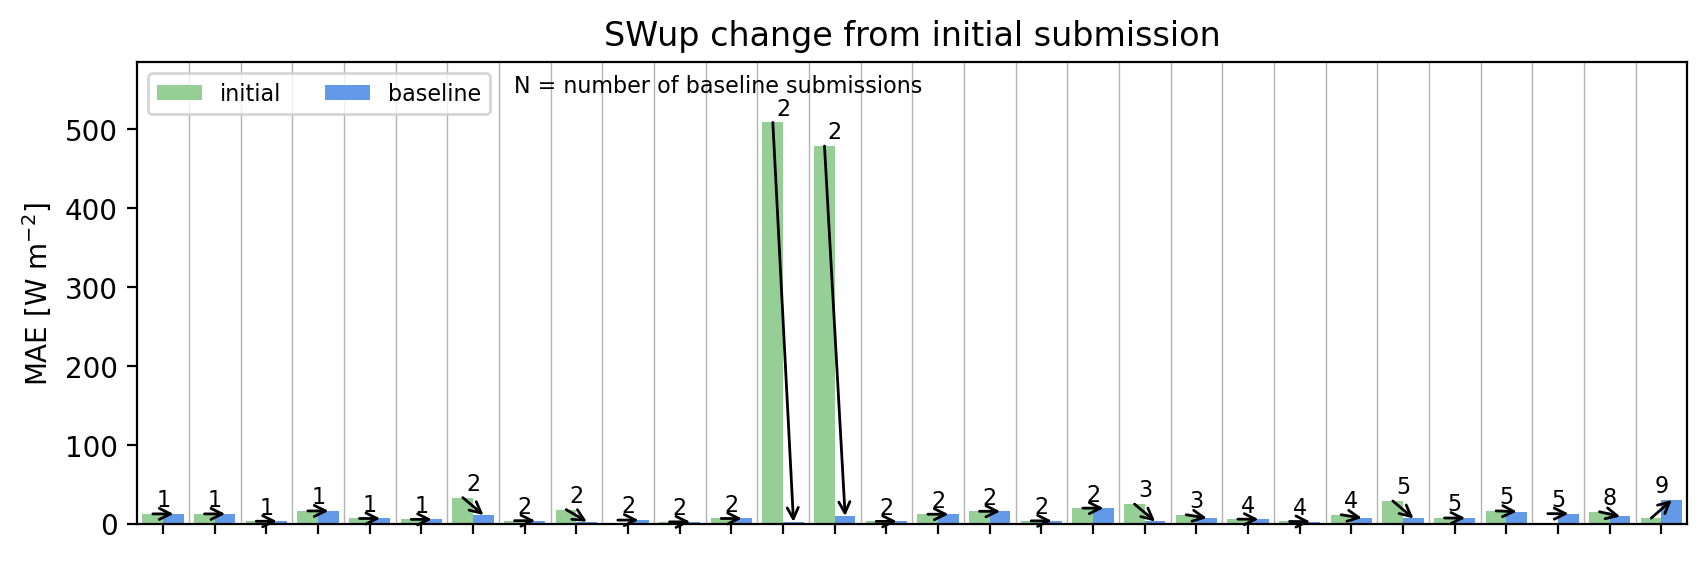
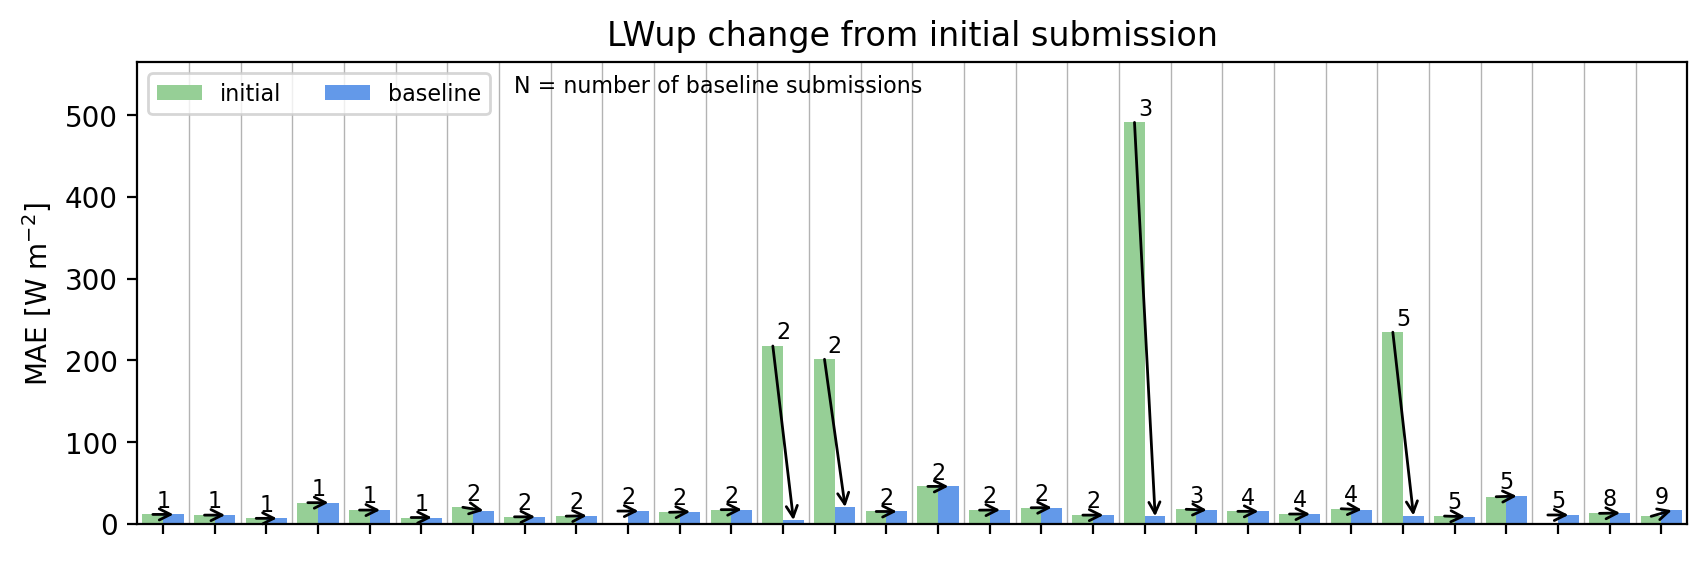
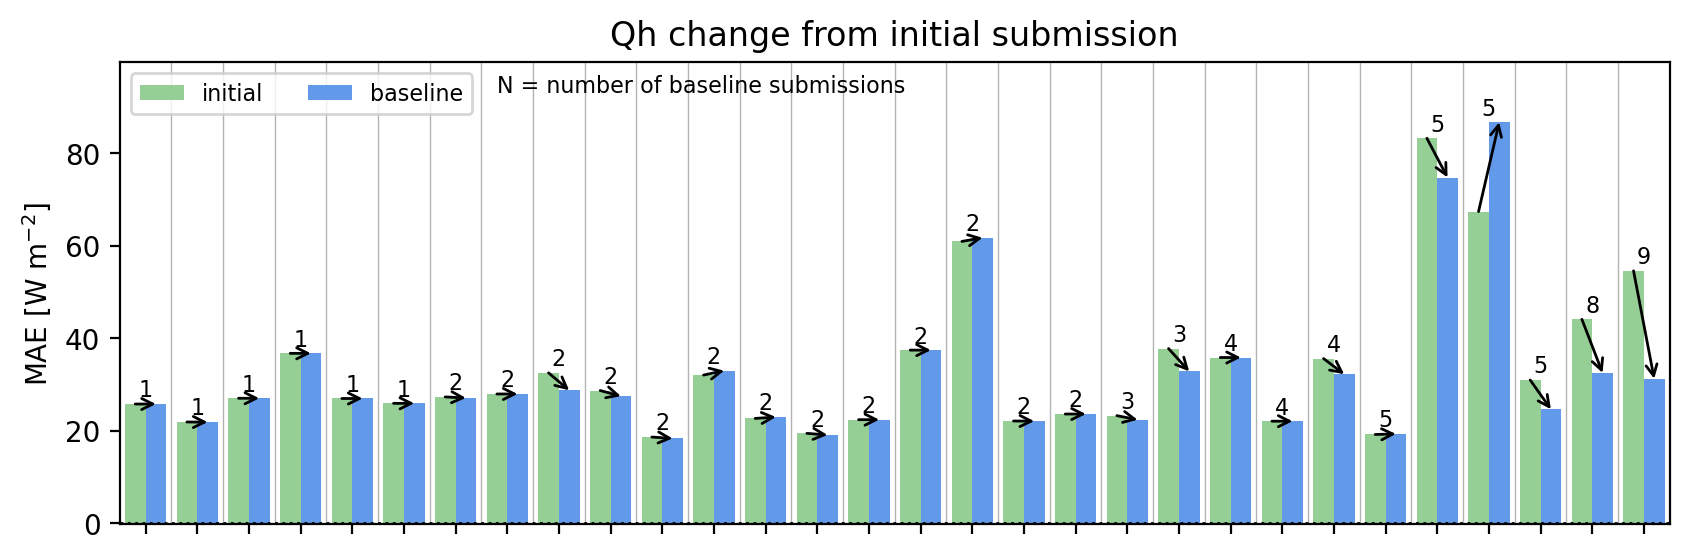
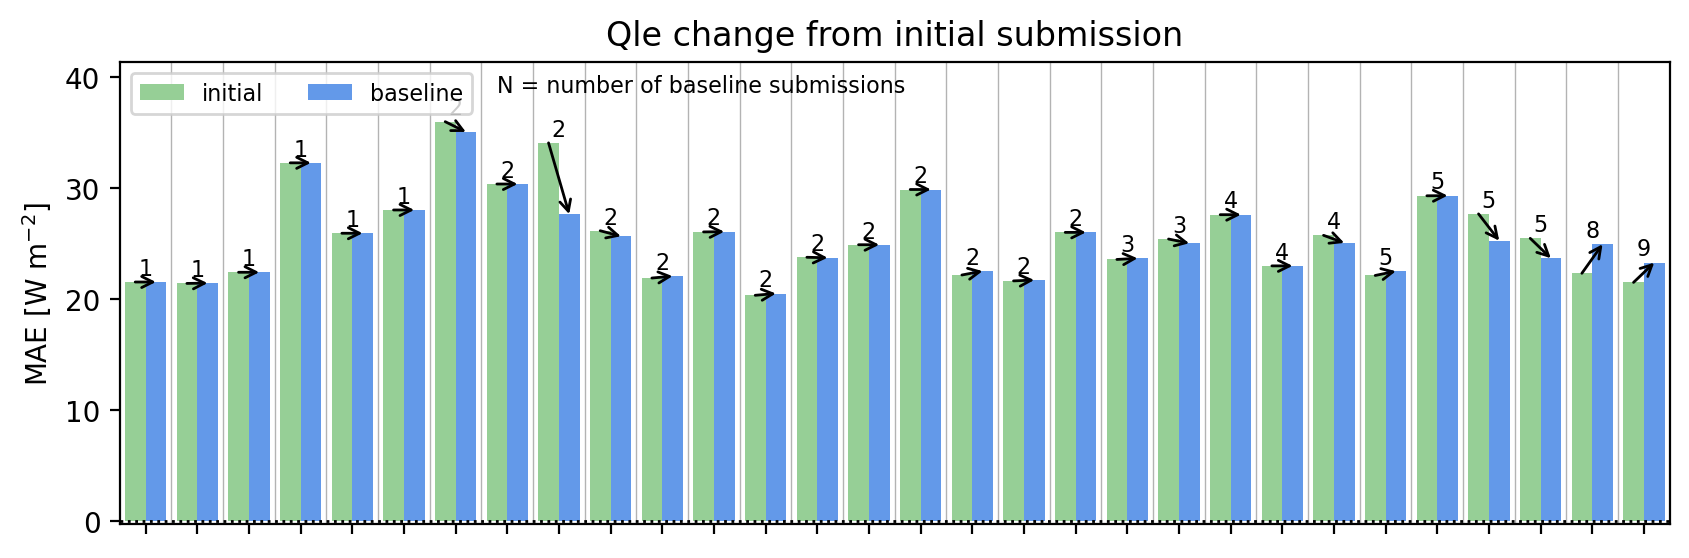
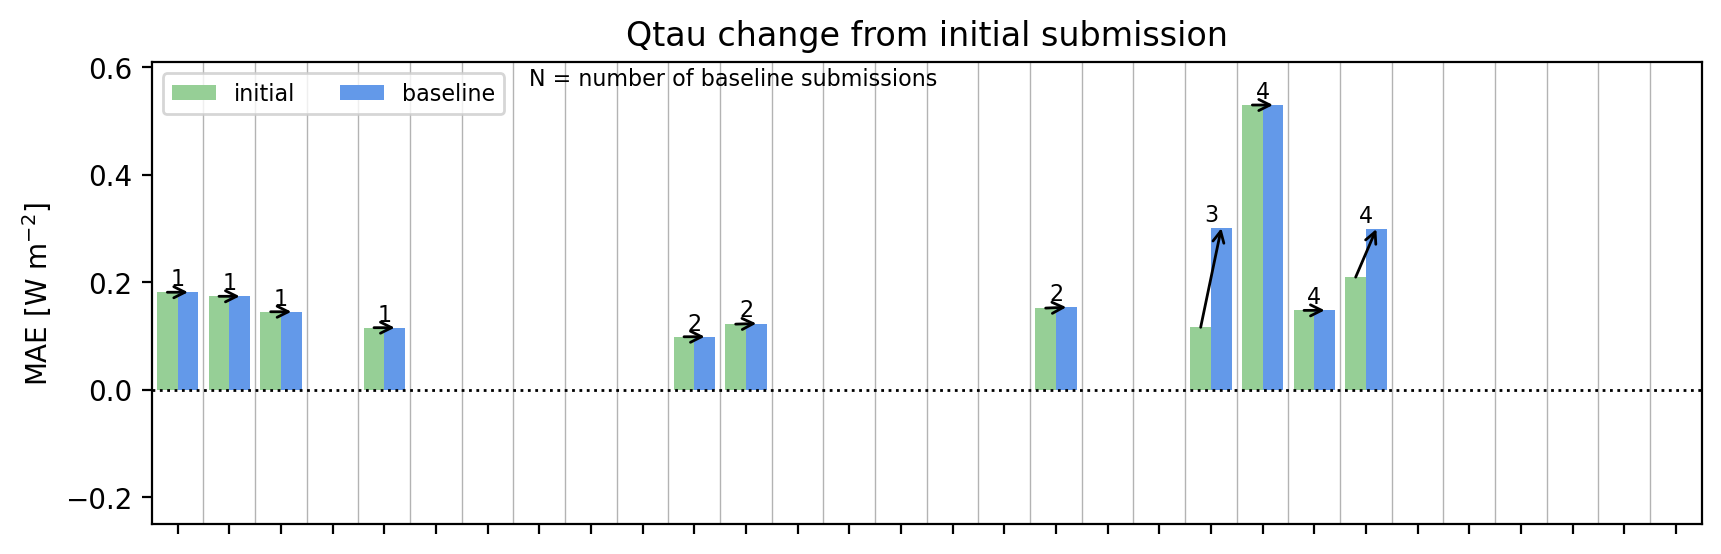
Fig. S6: By previous experience with the site
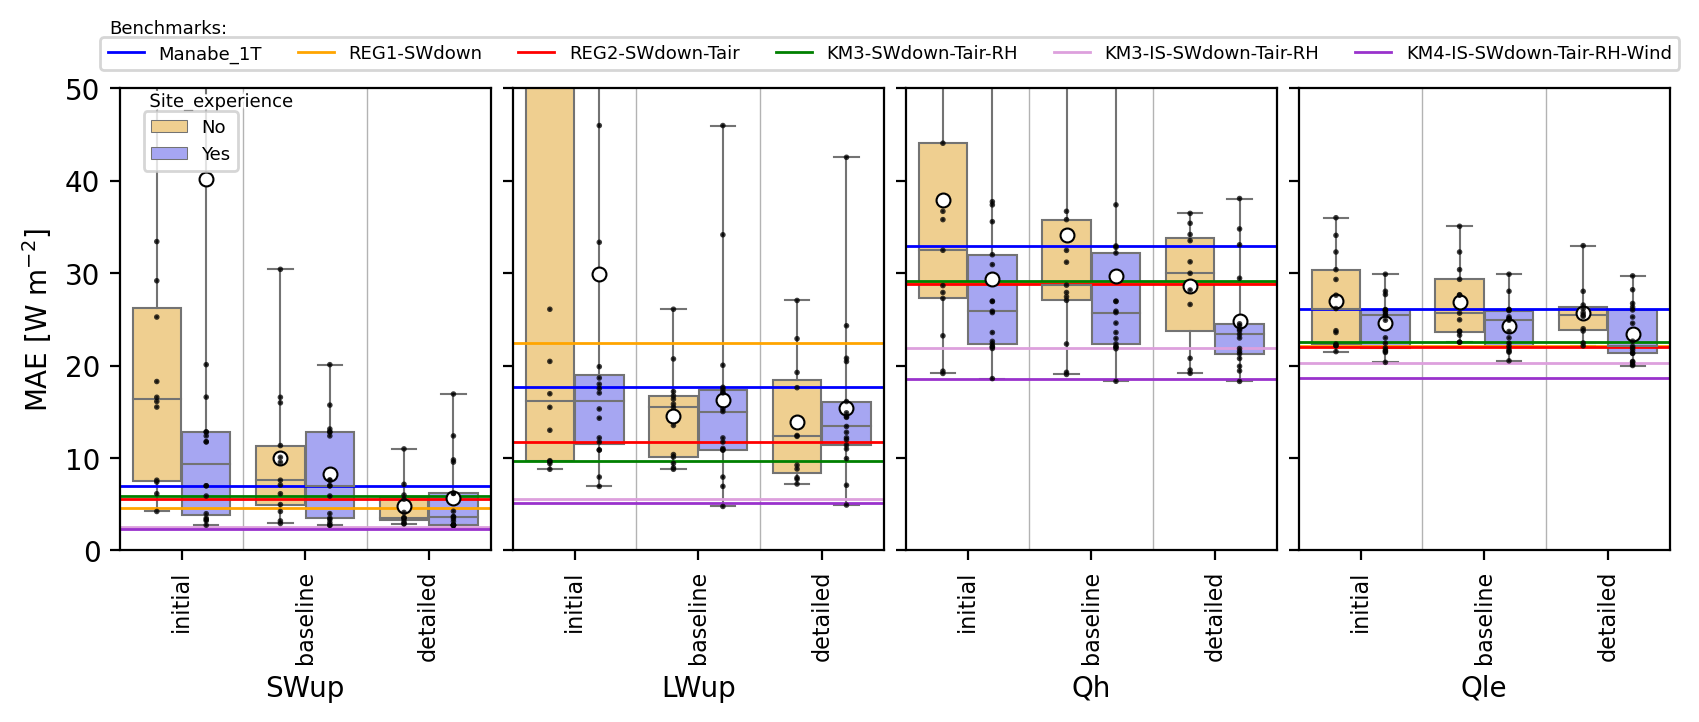
Fig. S7: By complete spinup
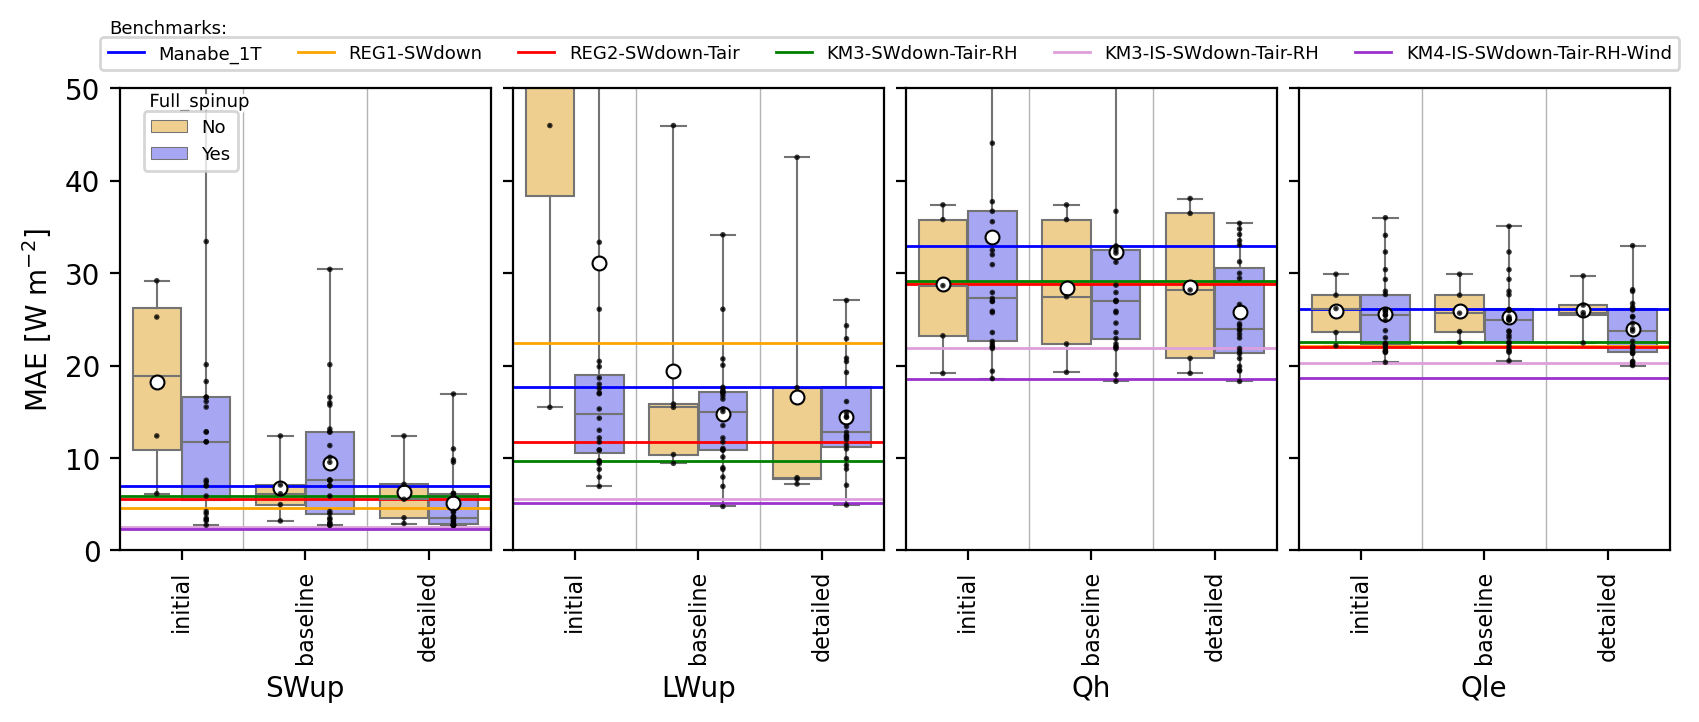
See plot of simulation durations
Fig. S8: By energy closure
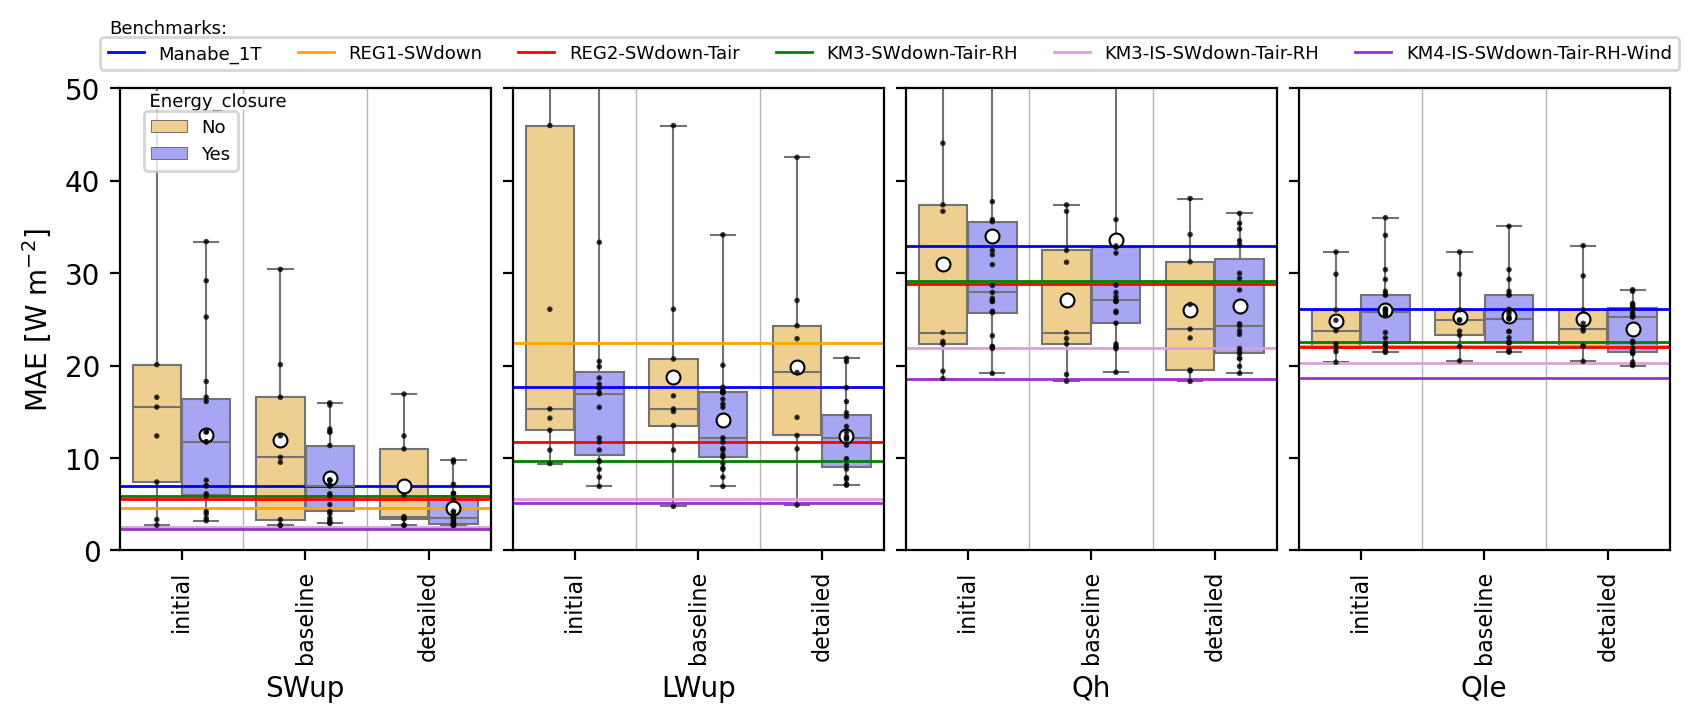
Fig. S9: Benchmark evaluation for daytime periods: Common metrics
Metrics for MAE, MBE, nSD, R as defined in Table A.1. See Figure 8 caption in the original article for further details.
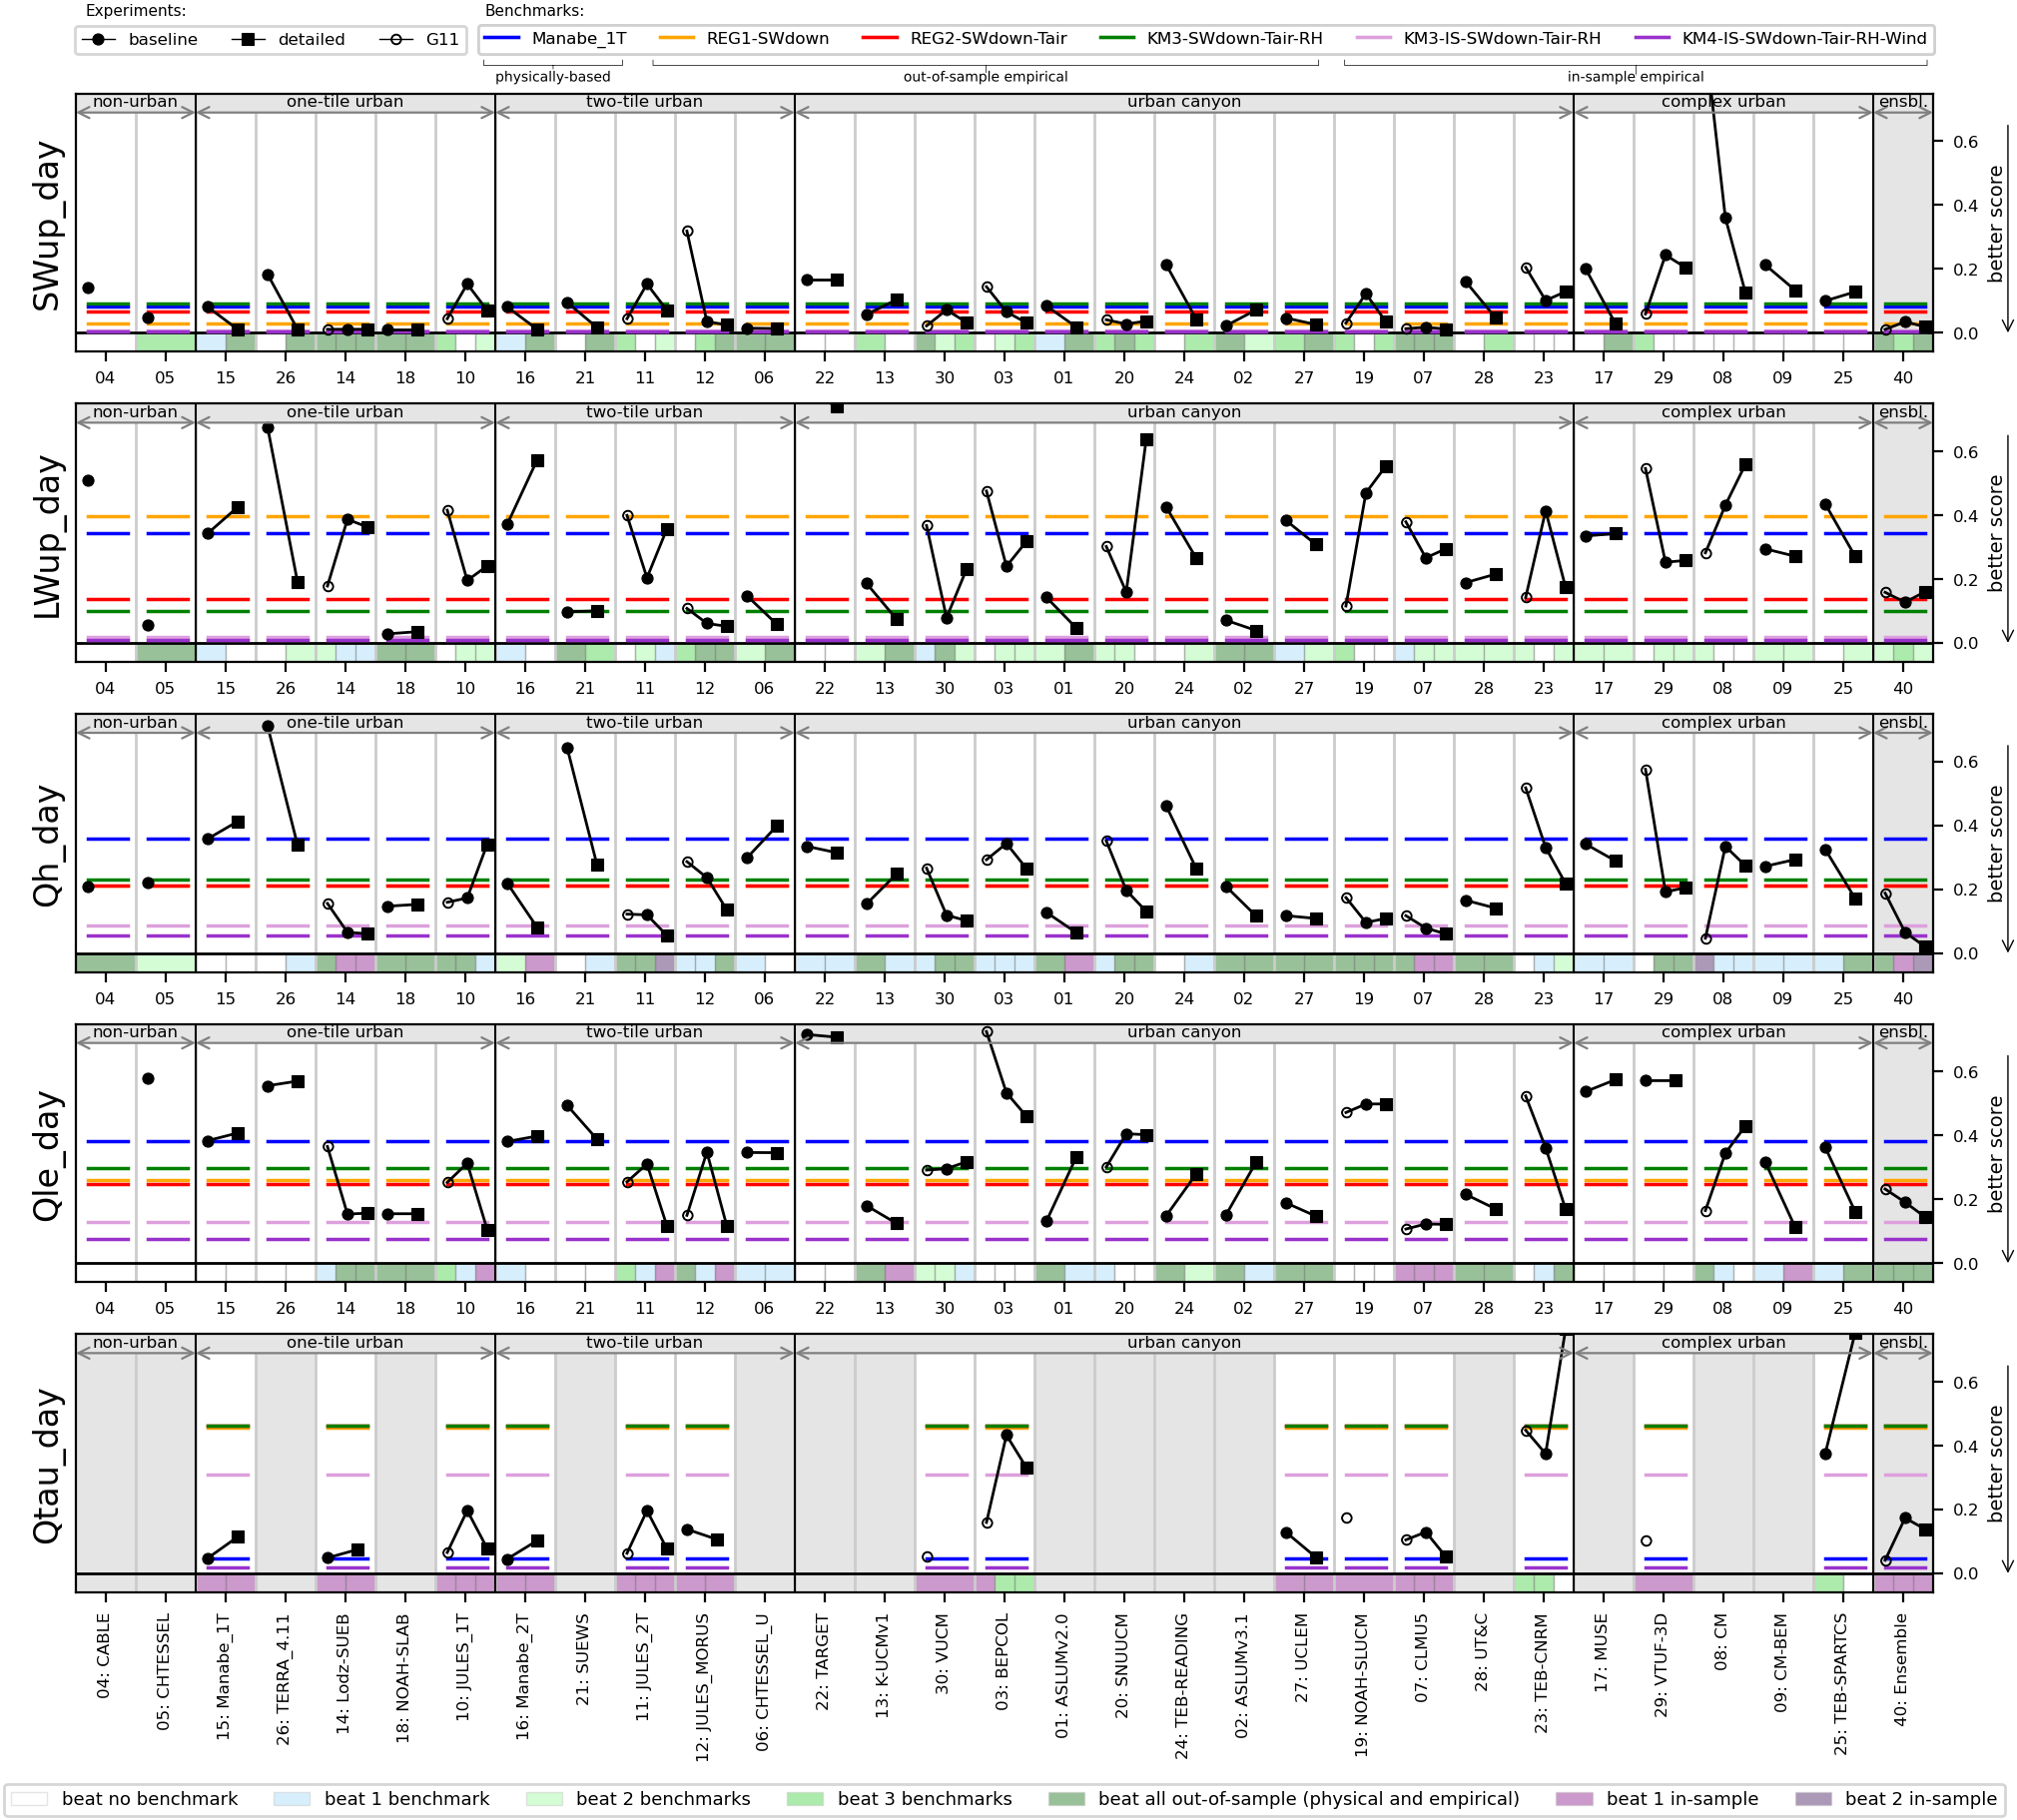
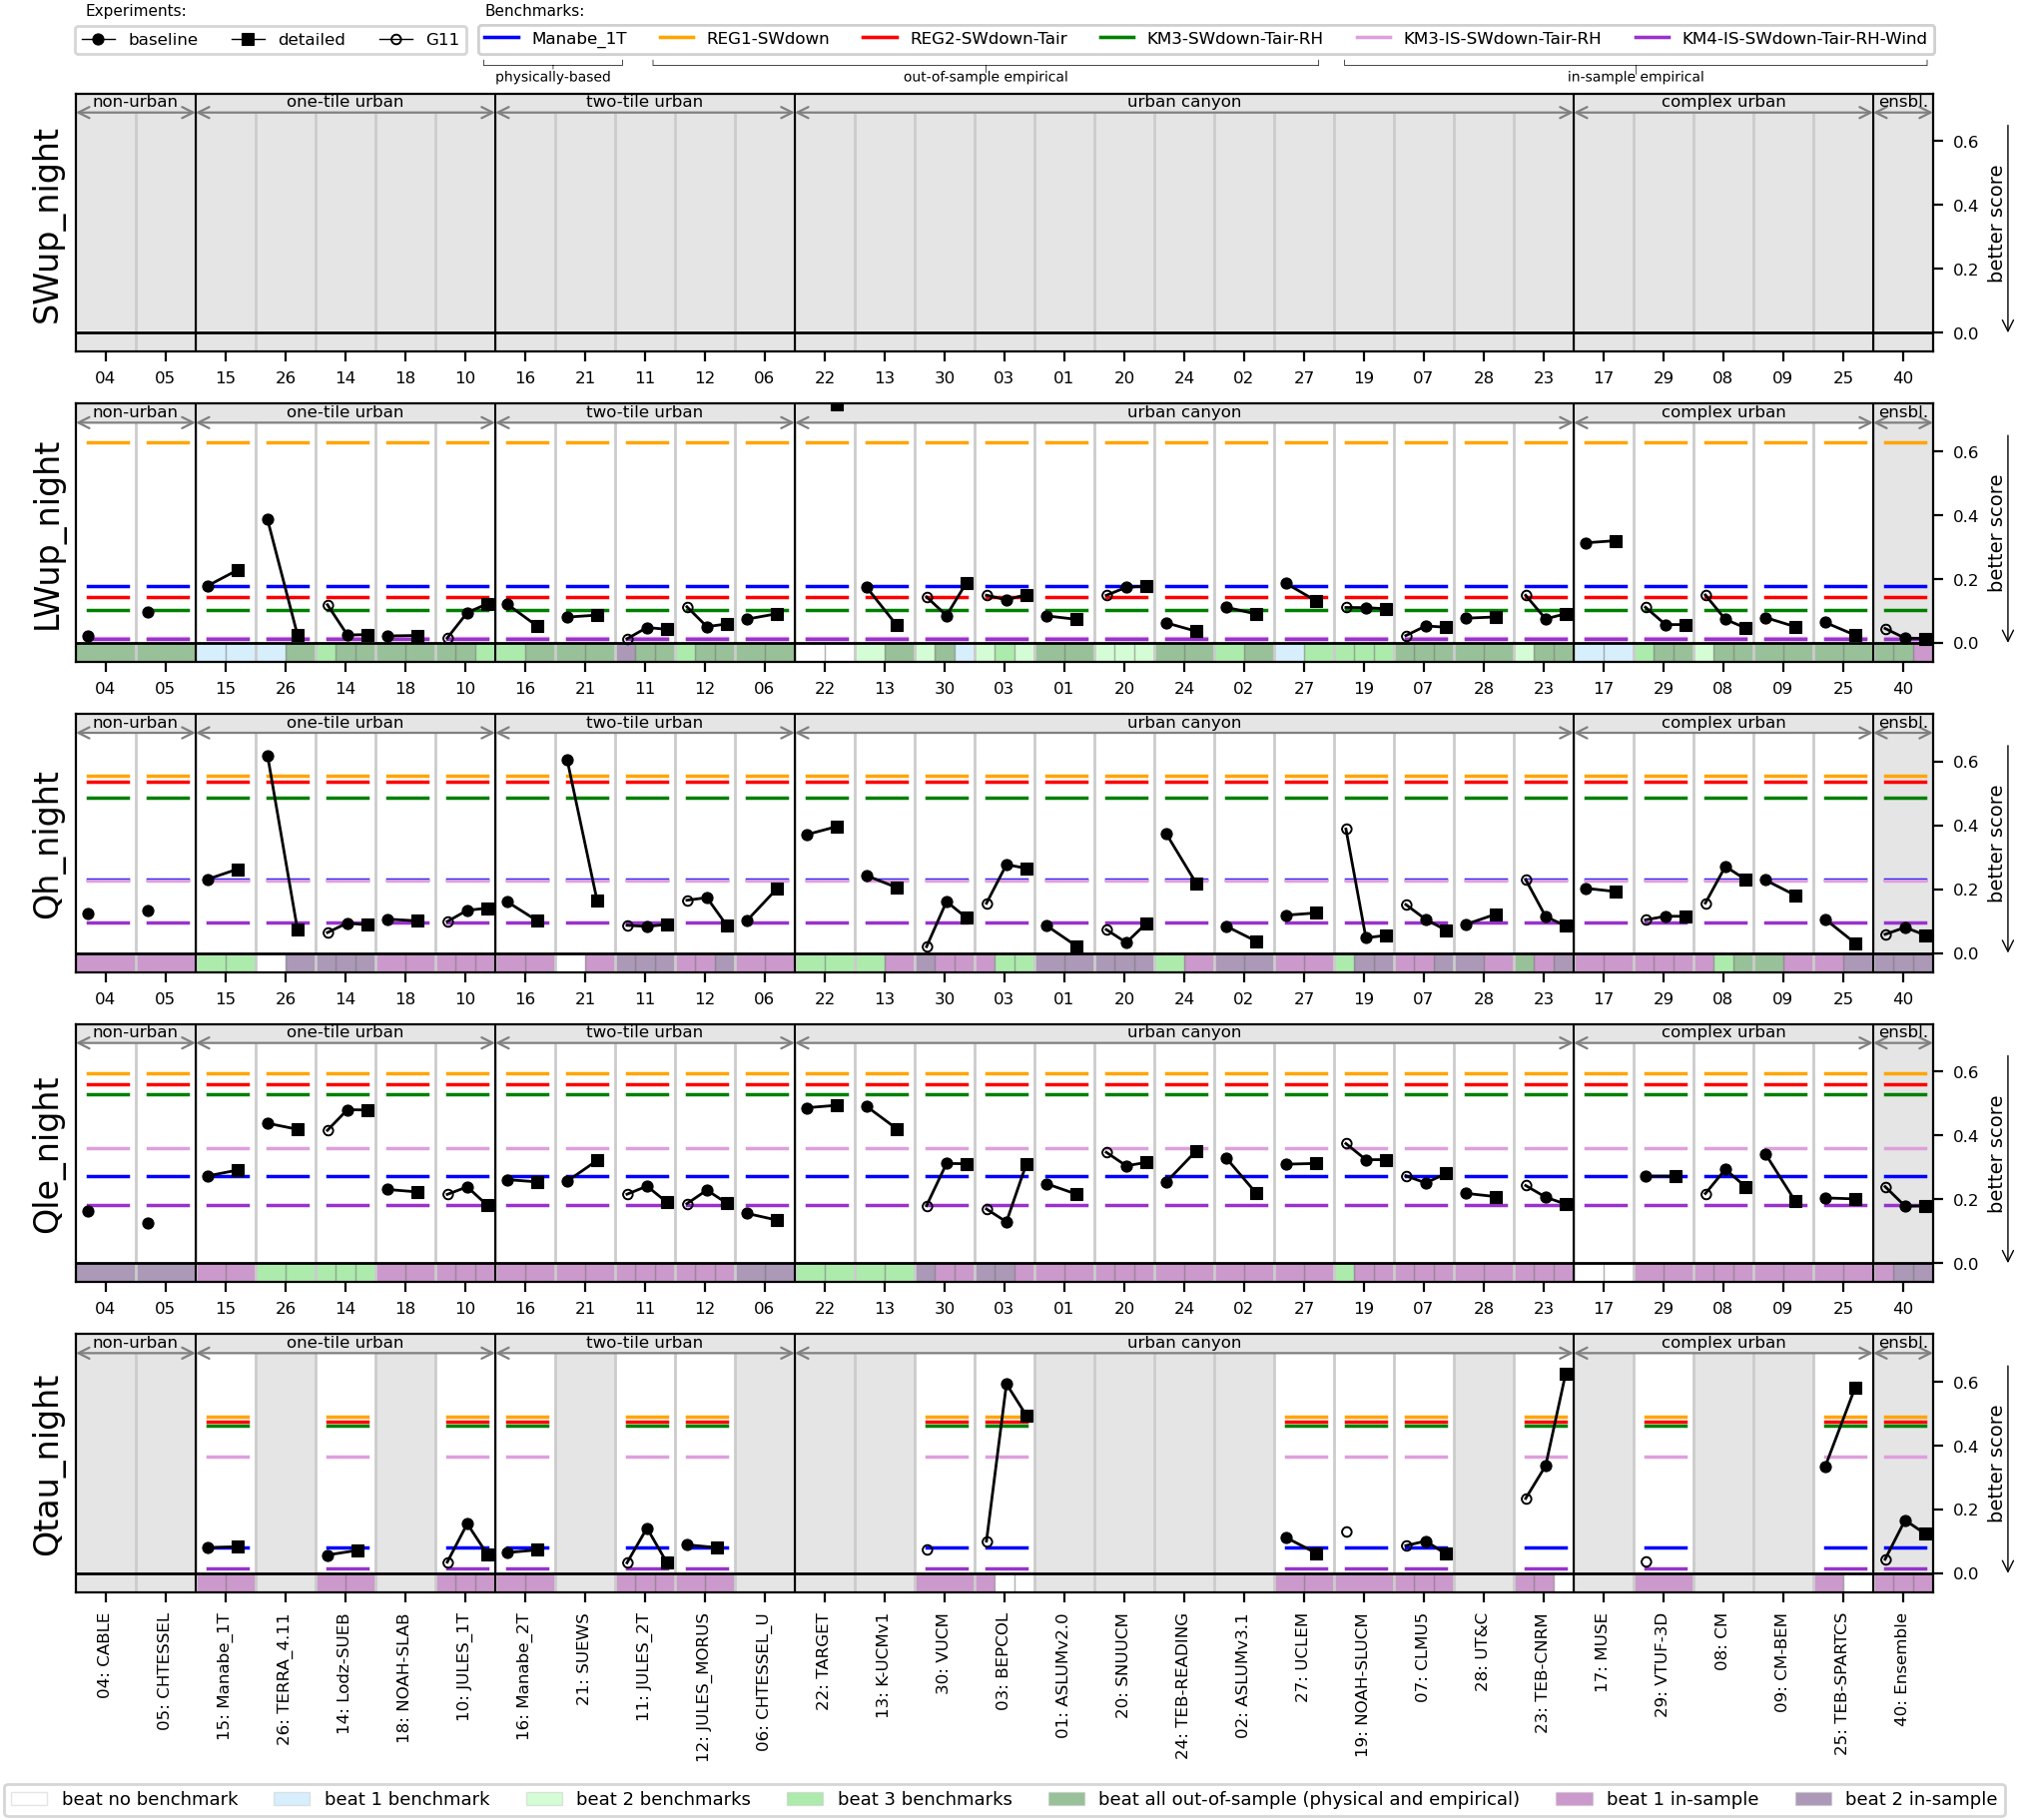
Fig. S10: Benchmark evaluation for nighttime periods: Common metrics
Metrics for MAE, MBE, nSD, R as defined in Table A.1. See Figure 8 caption in the original article for further details.